Azure

How to Stop and Start an Application in Azure

Introduction

There are times when you need to completely stop and restart an application in Azure, particularly when a simple restart via the Umbraco portal does not resolve the issue. The key difference between a basic restart and a full stop-and-start process is that stopping the application entirely ensures that no background processes remain active, providing a fresh restart.

This guide outlines the steps needed to stop and start an application in Azure. Before proceeding, ensure you have the required access permissions.

Step 1: Identify the Environment

  1. Navigate to the /status page using the following URL:

    • https://www.s1.umbraco.io/projectsupport/project-name/hosting

  2. Identify the environment you need to stop and start.

  3. Open Azure, and navigate to the specific environment.

Step 2: Gain Access Permissions

To perform this action, you must first ensure you have the correct role assigned.

  1. In the Azure portal, click on Access Control (IAM).
  2. Select View My Access.

  1. A pop-up window will open. Click on Eligible Assignments.
  2. Click on Contributor, then select Activate Role.

  1. Another pop-up will appear asking for justification. Provide a clear reason, such as:
    • “Site down, attempting to stop and start the application to restore functionality.”
  2. Click Activate.

  1. Wait until all stages display a green checkmark.
  2. You will receive a notification confirming that the Contributor role has been successfully activated.

Step 3: Stop the Application

  1. Once your access has been activated, navigate to Overview.
  2. Click on Stop.
  3. A confirmation pop-up will appear—confirm the action.

  1. Navigate to the project’s domain. You will now see a 403 Error Page along with a blue screen indicating that the application has been stopped.

Step 4: Start the Application

  1. In the Azure portal, click on Start to restart the application.

Important

Do not touch any unnecessary buttons while having the Contributor role activated.

Checking Database Performance in Azure

General

In some cases, users may experience performance issues with their back office or site. If the Database Transaction Unit (DTU) is maxed out, but you are unable to identify the specific queries causing the issue due to lack of permissions, follow these steps to gain access and troubleshoot.

Step 1: Locate the Database

  1. Navigate to the Azure portal and go to the Project > Configuration > Connections.
  2. Identify the environment for which you want to check the database.
  3. Copy the database name.

  1. Go to Azure Portal and paste the database name in the search bar.

Step 2: Gain Access to Query Performance Insights

  1. Navigate to Intelligent Performance > Query Performance Insight.
  2. A graph will display multiple queries along with CPU usage data.

  1. If you attempt to click on a query, but an error states that you do not have access, follow the next steps to gain necessary permissions.

Step 3: Obtain Contributor Access

  1. Return to the Overview section.
  2. Click on the Resource Group associated with the database.

Now click on the Click here as shown in the image below:

Click on Access Control (IAM) > View My Access.

  1. A pop-up window will appear. Click on Eligible Assignments.
  2. Click on Contributor, then select Activate Role.

  1. Another pop-up will appear asking for justification. Provide a clear reason, such as:
    • “Investigating database performance issues related to high CPU usage.”
  2. Click Activate.

  1. Wait until all stages display a green checkmark.
  2. You will receive a notification confirming that the Contributor role has been successfully activated.

Step 4: View Query Performance Details

  1. Return to Intelligent Performance > Query Performance Insight.
  2. Click on the query with the highest CPU consumption.

3. You will now be able to view query details without the previous access restriction.

Azure events & downtime investigation

Site down investigation - Azure maintenance, platform upgrade, auto-healing or recycling

Sometimes a site goes down or experiences a very weird behaviour like:
- Not receiving an autoupgrade
- Examine Indexes failing to create and getting corrupted
- Some service stops running or experiences interruptions
- Cold/Warm boots
- Performance goes haywire 

While there could be many various reasons why this happens, one common reason is that an Azure event has happened on the app service plan (server) and caused irregularities and disruptions.

This will be a guide on how to check if such an Event has happened.

We’ll have as an example an actual Umbraco Cloud project that went down and experienced downtime because of these events

This project is called: Horeca Vlaanderen - Erkend Friturist

Let’s start the investigation.


1. First step will be going to Azure on the environment where the issue happened

Go to Azure

2. Diagnose and solve problems > Availability and performance

Diagnose and solve problems - Availabilty and performance

3. Under Web app down you’ll see irregularities, spikes and downtime - this will indicate that something actually happened with the web application (specific cloud environment).

You’ll also be able to see that the Organic SLA is not perfect 100% which means that the site did go down or experienced performance issues.

Web app down

4. Next, we’ll want to check what happened and why do we see downtime and for that one of the best places to check will be Web App Slow.

Web app slow

Now we can see what happened. We have two different events.

-
Platform(File Storage)
This means that the server had trouble talking to its storage (like a shared hard drive in the cloud). To fix it, Azure automatically restarted the application on a healthier connection. This restart is called a "recycle."

For an Umbraco Cloud project, this can mean:

  • The site might briefly restart, causing a short outage or slow response.

  • The site might experience a cold boot, meaning that the site starts up from scratch (like turning on a computer that was fully shut down). This usually takes longer because the app needs to load everything fresh into memory.
    However, if a restart is performed the Umbraco project enters a weird state where it requires to be restarted before it starts working again - this is something that is happening constantly on Umbraco Cloud.

- Delayed Start
This means that the Umbraco Cloud site didn’t start right away after a restart — the platform waited before bringing it fully online.

This can happen if Azure is managing resources, applying updates, or ensuring storage/services are ready.


Conclusion

Based on these events we clearly can determine that something has actually happened on the app service plan that has caused disruptions and it is safe to share these events with the customer explaining what happened.

What exactly do we tell the customer though?

Well, we have to be transparent and honest.
Azure has performed some events that we are not in control, that have caused the disruptions they have experienced.
We then can share screenshots of the events that happened

Azure events

How can we prevent this from happening?
In short, we can’t. Umbraco is not in control of these Azure events however, most of the times these events come with the CPU usage on the entire app service plan (server) maxing out, causing resource exhaustion. During the exhausted period, the site can fail from multiple places like Indexes, NuCache, Services etc.
Based on this, we can definitely suggest that if their website is a critical website, moving on
dedicated resources would be a very smart idea.
Additionally, we are working on improving the behaviour of an Umbraco website on Umbraco Cloud when these events happen so hopefully in the future it will be handled better.

Note

Do note that: even if these events start at a specific time, they can last for a longer period of time. This is just in case the timestamps of when the customer noticed their site going down and the Azure events don’t match.

Azure Funadamentals

1. Introduction

Purpose of this guide

This guide opens the door to everything you need for investigating different issues with environments on Azure. It explains key concepts like App Services and SQL Databases, shows you practical steps for troubleshooting and monitoring, and maps out how Azure components fit together in our hosting setup. 

When and why you use Azure as support

  • Investigate issues reported by customers(such as downtime, slow performance, deployment issues)

  • Monitor resource usage and diagnose infrastructure-level issues (CPU, memory, database load)

  • Understand how our Umbraco environments are hosted and how they relate to customer Azure resources

Overall, we will be using mostly these sections:

2. Accessing Azure

3. Key Azure Concepts (Simplified Definitions)

  • Resource Group = A container that organizes related resources for an Azure Solution

  • App Service Plan = Server (location, power, cost, etc.) that controls how your apps run

  • App Service (Web App) = Your actual Web App or site

  • Metrics (Environment-Level) = A live dashboard showing how much CPU, memory, etc a specific environment (like Live, Development, or Staging) is using.

  • SQL Database = The place where the app saves and looks up its data

  • Application Insights = Smart diagnostics dashboard 

3.1 Resource Groups

A Resource Group in Azure is like a folder where you organize and keep related items together. 

To make it simpler, imagine you're working on a project and you have all the files, like documents, pictures, and spreadsheets, stored in one folder on your computer to keep everything organized.

For context, imagine you have 4 Umbraco Cloud projects:

  • Project A (Production site for Client 1)

  • Project B (Development site for Client 1)

  • Project C (Production site for Client 2)

  • Project D (Development site for Client 2

These 4 projects could be stored in two different Resource Groups, something like this:

If you click on the Resource group, you will see that for example it contains 2 App service Plans, 50 App Service, and multiple alerts.

Overall, each resource group contains the specific resources needed for each Umbraco project.

3.2. Azure App Service (Web App)

An App Service in Azure is like a fully managed web hosting service. Imagine you want to launch a website or an app without worrying about setting up or managing the server yourself.

Azure App Service takes care of everything for you, like handling the servers, scaling, and even keeping your app secure. You just upload your code, and it runs your web app, API, or backend service smoothly. It’s like renting a fully set-up restaurant kitchen where you only need to bring the recipes, and everything else (like the stove and ingredients) is taken care of.


What it is:
The actual hosted environment (Live, Staging, etc.)

Most-used sections: 

  • Diagnose and Solve Problems → Availability & Performance.

  • Diagnostic Tools → Application Event Logs

Diagnose and Solve Problems → Availability & Performance

What it is:
This is Azure’s built-in diagnostics hub. It automatically scans for problems in your app.

Why do you check it?
This is your
starting point for troubleshooting when:

  • A site is down or slow

  • You believe CPU or memory is too high

  • You suspect a deployment failed due to system constraints
    It provides
    guided investigations into common issues like: App crashes, Restart history, Platform vs app availability, High CPU usage,4xx/5xx errors

When to use: Every time there's an incident, especially when somebody complains about downtime, slowness, etc.

  • TCP Connections

  • Memory Analysis

  • Application Events

Diagnose and Solve problems -> Availability and Performance

Most relevant diagnostic tools in this section are:

1. Web App Down

  • What it shows: Whether your app was unreachable during a specific time range.

  • Why it matters: It confirms if and when your app experienced downtime and whether it was caused by:

    • Azure platform issues (green line = platform)

    • Your application is crashing or misbehaving (blue line = app)

  • When to use: First step when users report a site outage.

 2. Web App Slow

  • What it shows: High response times, slow requests, or timeouts.

  • Why it matters: Helps you understand why the site is sluggish, especially when memory or CPU seems normal.

  • When to use: When the site isn’t down but is responding slowly, often tied to spikes in traffic or heavy operations, as well as when there is a platform maintenance, file storage upgrade, and so on.

 3. High CPU Analysis

  • What it shows: CPU usage trends and what operations consumed the most processing power.

  • Why it matters: It lets you trace the root cause of performance degradation or automatic restarts. Overuse by one app can affect others in shared plans.

  • When to use: When investigating downtime, possible DDoS, “noisy neighbors,” failed deployments, or frequent auto-restarts.

4. Web App Restarted

  • What it shows: Times your environment was restarted (manually, automatically, or due to CPU/memory limits).

  • Why it matters: Explains unexpected downtime or application resets — especially useful when an environment stops responding temporarily.

  • When to use: When someone asks, “Did the environment restart?” “Why did my deployment not go through?” or  “Why does my environment experience cold/warm boots?”

 5. Application Crashes

  • What it shows: Unhandled exceptions and critical app failures.

  • Why it matters: Detects broken code or crashing deployments, especially after a release.

  • When to use: Right after a deployment, downtime or code change that led to instability.

6. Memory Analysis

  • What it shows: Memory usage trends per environment in the App Service Plan

  • Why it matters: Identifies memory pressure or leaks that could lead to outages or app restarts

  • When to use: When investigating memory spikes, slowdowns, or restarts

7. TCP Connections

  • What it shows: The number of active TCP connections your environment has open at a given moment.

Analogy: It’s like a highway with a limited number of lanes. Each connection is a car using one lane. If all lanes are full, no new cars can get through, and traffic stalls. Reusing connections helps free up lanes and keep traffic flowing.

  • Why it matters: TCP connections are like open communication lines between your app and other services, such as APIs or databases. Each App Service Plan has a limit on how many connections it can handle per instance. If this limit is reached, new connections may fail, causing errors or timeouts. This is especially important in shared environments where multiple apps compete for the same connection capacity.

  • When to use: When investigating downtime, especially if the site was reachable at times and unresponsive at others. It helps determine if the environment hit a connection limit during peak activity.

7. SNAT Port Exhaustion

  • What it shows: The number of SNAT (Source Network Address Translation) ports used by your environment, that is, how many outbound connections are in use that consume SNAT ports.

Analogy: Think of SNAT ports as parking spaces outside your house. If all spots are taken, no new cars can park, and those drivers have to wait or go elsewhere.

  • Why it matters: SNAT ports are required when your app makes outbound calls (e.g., to databases, APIs, or external services). Azure limits how many SNAT ports each instance can use—typically 128 pre-allocated ports per instance, but this may vary based on plan and scale. When SNAT ports run out, your app can’t open new outbound connections, causing timeouts or failures. Ensuring SNAT port usage stays under the limit prevents intermittent connectivity issues 

  • When to use: To determine if your app reached a connection ceiling during peak usage, especially when troubleshooting intermittent outbound failures.

8. SNAT Failed Connection Endpoint

  • What it shows: Specific outbound connection attempts that failed because SNAT ports were unavailable.

Analogy: Imagine drivers circling airport parking but can’t find a free space. Even though they’re trying hard to park, they have nowhere to go. This metric shows exactly how many cars were unable to park.

  • Why it matters: This metric identifies when and how often connections were blocked—offering direct insight that SNAT port exhaustion is impacting functionality. It confirms that failures are not due to code errors or external service issues but are caused by network limits being hit 

  • When to use: When investigating connectivity problems during outages, especially if failing outbound requests coincide with SNAT exhaustion events.

What it shows: A chronological list of internal messages from the app, including information, warnings, and errors. These logs are generated by the hosting environment (IIS and .NET runtime) and capture what happens when the app starts, runs, or fails.

Why it matters:
Azure collects these logs to help you understand what happened inside the application. This is especially useful when a deployment fails, or the app crashes. For example, during a downtime, you might see a message like "Failed to gracefully shutdown application," which can indicate an issue during app restart or deployment.

Sometimes the log may even reference the method, file, or line in your code where the failure occurred. For example, you may see something like "Exception in Program.cs line 42"—which helps developers identify if there is a bug in the application logic, a misconfigured setting, or a failure in a third-party dependency.

Analogy: Think of it like a flight recorder (black box) for your web app. It doesn’t show everything the app is doing, but it records key events just before and during an incident. These logs can help pinpoint what went wrong right before the crash.

When to use: When the site goes down or doesn't respond after a deployment or restart. This is one of the first places to check to see if the app failed to start, crashed, or hit a runtime error. It can help distinguish between infrastructure issues and application bugs.

3.3 App Service Plan

What it is:
The shared compute infrastructure for multiple environments

An App Service Plan in Azure is like choosing a hosting plan for your website or app. Imagine you want to create a website, and you need a place to run it. You'd decide how much power, speed, and space you need,  just like picking a subscription plan with a hosting company.

In Azure, the App Service Plan determines the resources (CPU, memory, and storage) available for your web app or API to run smoothly. It’s the "engine" behind your app, deciding how strong and fast it will be.

An App Service Plan can host one or multiple app services, and these represent either shared or dedicated resources.

Shared Compute means your app is using the same resources (like CPU and memory) as other apps within the same App Service Plan.

Example:

Let’s say:

  • Live from Project A

  • Staging from Project B

  • Live from Project C
    are all hosted under the same App Service Plan. This can include 15–20 different environments across projects.

Now imagine:

  • The App Service Plan is already using 80% of the total CPU across all these environments.

  • Live from Project A gets a spike in visitors due to a new campaign.

  • CPU rises to 100% to handle this spike.

  • Then Live from Project C also gets a user spike due to a new product release.

Since the App Service Plan has already reached 100% CPU usage, there are no extra resources left. As a result, Project C’s environment experiences slowness or downtime.

Analogy:

It’s like living in an apartment building where you share water and electricity with your neighbors. It’s cheaper, but if someone uses a lot, others are affected. You might suddenly run out of hot water if your neighbor is using it all.

Resource Limits & Noisy Neighbors

Each plan — Starter, Standard, and Professional — has a limit on how much CPU and memory an environment can use.

  • If an environment exceeds this limit for more than a few minutes, it may get restarted automatically to release resources and bring usage back to normal.

  • But this restart can only happen once every 24 hours.

  • If an environment continues to overuse resources after that, it becomes a "noisy neighbor", affecting the performance of other environments on the same plan, with no further safeguards until the 24 hours pass.

Dedicated Compute

Dedicated Resources means your app has its own reserved resources — it doesn't share them with anyone else.

Example:

  • Live from Project A uses its own CPU and memory.

  • It doesn’t share with any other environments from other projects.

  • However, it can choose to share with Staging and Development from the same Project A, if needed.

Analogy:

This is like living in your own house — you don’t share your water or electricity with anyone. You get consistent performance, but it costs more.

How to Find the App Service Plan in Azure

When you're inside a specific project and environment, and you open Azure:

  • You will see number 1: the ID for the Live environment from Project A.

  • The App Service Plan is highlighted in number 2 and 3.

  • If you want to see more detailed resource usage (CPU, memory, etc.) and understand what else is running under the same plan, click on the App Service Plan name, highlighted as number 4.

This will take you directly to the shared or dedicated App Service Plan dashboard in Azure.

Click on the name of the App Service Plan and you will be sent to the next section where you can see two sections.

One section in which you can see the essentials, which I will describe below, and one section that presents different metrics to visualize.

The Essentials section summarizes key configuration details of the App Service Plan:

  • Name: asp-s1-hosting-tier1v2-02 — the name of your Azure App Service Plan.

  • Resource Group: rg-s1-hosting-websites-tier1v2-22 — logical container for Azure resources.

  • Status: Ready — service is running and available.

  • Location: West Europe — your server is physically located in this Azure region.

  • Subscription: Umbraco Cloud Live — the Azure subscription your Umbraco instance is running under, not something we use, just part of the Umbraco hosting infrastructure.

  • Subscription ID: bc8cf68c-1230-48d2-939d-9a76bdc98a28 — unique ID for your subscription.

  • Pricing Plan: P1v3 — Premium v3 plan, offering better performance (CPU/RAM), SSD storage, and faster scaling, this is the plan Umbraco uses with Azure and not the project itself.

  • Instance Count: 1 — only one instance (VM) is running for this App Service Plan.

  • App(s)/Slots: 31 / 0 — you have 31 App Services (likely multiple environments for staging/live/test) and no deployment slots.

  • You have Instance count: 1, this means all 31 apps running under this service plan share one single VM (virtual machine).

  • Operating System: Windows — this App Service runs on a Windows-based server.

The Metrics section allows you to visualize and compare various performance indicators such as CPU usage, memory consumption, data in, data out, and more.
To add a new metric:

  1. Click on "Add metric" (1)

  2. Select a metric from the available list (2)

  3. Choose the desired time range for analysis (3)

Why do you check it?
This is
critical when you're investigating "noisy neighbor" problems, like:

  • One environment spiking CPU/memory and affecting others

  • Understanding how many apps are sharing the same plan

  • Tracking how much load your plan is under

It lets you:

  • Monitor average CPU/memory usage and other metrics, but these two are the most useful.

When to use: When performance issues span multiple environments, or you suspect shared capacity is causing outages.

3.4 Monitoring (Environment Level Only)

Found under: Monitoring > Metrics

  • Only shows metrics per environment (Development, Staging, Live)

What it shows: Visual charts of resource usage (CPU, memory, data in/out) over time for a specific environment, such as Development, Staging, or Live.

Why it matters:
This helps you understand how a single environment is performing without being affected by others on the same App Service Plan. It’s especially useful for spotting performance spikes or resource exhaustion that could lead to downtime.

Always remember to set the Aggregation to Average. Also, make sure the time range is aligned with other logs (like Application Event Logs), which are typically shown in UTC. This helps when correlating errors with performance events.

Analogy: It’s like a heart monitor for one room in a hospital. It won’t tell you what’s happening in the whole building (App Service Plan), but it gives you an accurate read of how that specific patient (environment) is doing.

When to use:
When users report slow performance or outages in a specific environment. Metrics help isolate whether that environment had a spike in CPU, memory, or traffic at the time. It also helps you see if the problem is isolated to one environment or more widespread.

We do not see metrics for the entire App Service Plan here, only what that specific environment consumes.

Most used metrics include: CPU, Memory, Data In, Data Out

CPU Time
What it shows: The amount of time the CPU spent processing your app’s code.
Measured in:
Seconds (per time interval)
Why it matters: High CPU time means the app is working hard. Spikes can signal heavy processing or an overloaded app.

Memory Working Set
What it shows: The amount of memory (RAM) your app is currently using.
Measured in:
Bytes (often shown in MB or GB)
Why it matters: Helps identify memory leaks or spikes that could slow down or crash the app.

Data In
What it shows: The amount of incoming data received by the app.
Measured in:
Bytes (per time interval)
Why it matters: Tracks how much data users or systems are sending to your app—useful for spotting traffic surges.

Data Out
What it shows: The amount of data the app is sending out (responses, API calls, etc.).
Measured in:
Bytes (per time interval)
Why it matters: Helps track bandwidth usage and how much information the app is returning to users or other systems.

3.5 SQL Database Monitoring

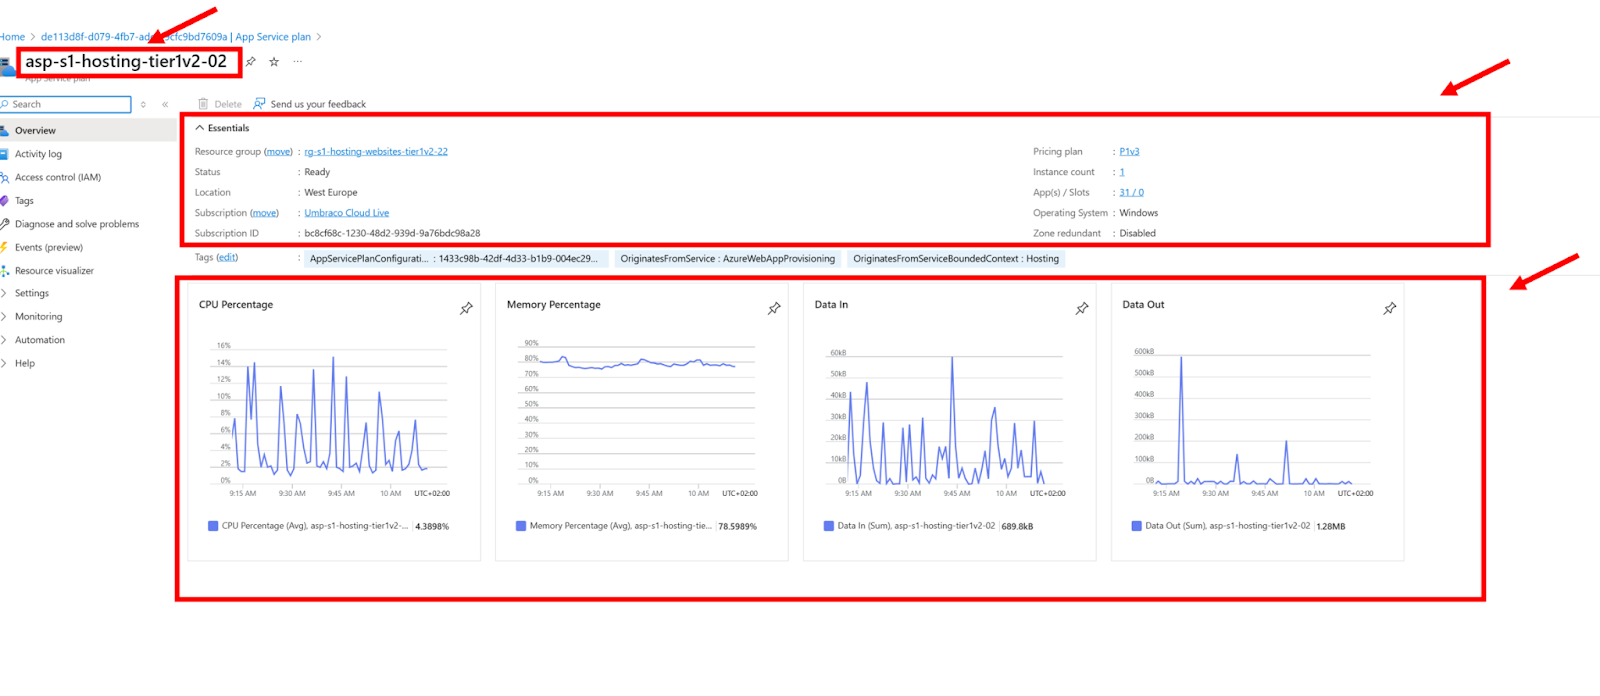
What it shows: A graph that visualizes how much of the database's resources are being used over time. The main thing to look for is the DTU percentage, which shows how “busy” the database is.

What is a DTU?
A DTU (Database Throughput Unit) is a measurement used by Azure to describe how much power your SQL Database has. It combines CPU, memory, and read/write speed into one single number so it’s easier to monitor performance.

You don’t need to know all the technical details behind it. Just remember this:

  • Low DTU usage (for example, under 50%) = your database is relaxed and can handle more work

  • High DTU usage (close to 100%) = your database is working very hard and may slow down or block other requests

Why it matters:
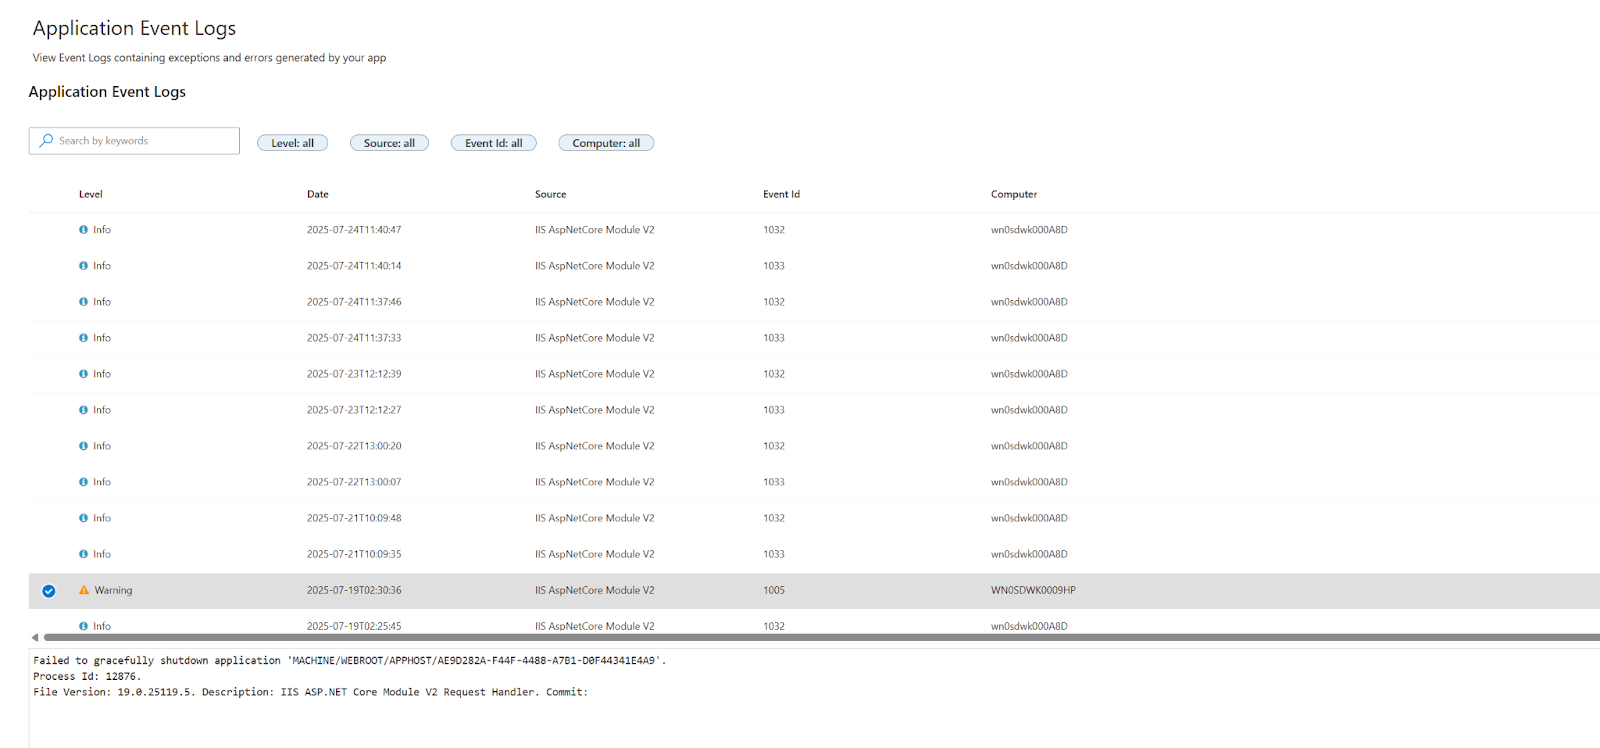
The SQL Database is where Umbraco stores all its structured data, everything from content and media references to user accounts and scheduled publishing. If this database becomes overloaded (too many requests at once, or a query that takes too long), it can slow down or even temporarily crash your Umbraco site.

Analogy:
Think of your SQL Database like a librarian in a busy library. If only a few people are asking for books, things move quickly. But if everyone asks questions at the same time, the librarian slows down, and people start waiting in line. The DTU percentage shows how overwhelmed your "librarian" is.

Performance issues caused by high DTU usage

1. Slow page loads in Umbraco
Pages that rely on database calls (like content-heavy pages, dashboards, or member logins) may load much more slowly or not at all.

2. Timeouts and errors
When the database is under too much load, it may start rejecting queries or taking too long to respond. This can result in:

  • "Timeout expired" messages

  • 500 Internal Server Errors

  • Content not rendering properly

3. Backend becomes unresponsive
If the Umbraco backoffice needs to fetch data for content editing, media management, or deploying changes—and the database is too busy—these actions may freeze or fail.

4. Deployments may fail
Umbraco deployments often include schema changes or data insertions. If the DTU is already high, the database might not respond in time, causing the deployment to fail.

5. Increased queue times for scheduled tasks
Background operations like scheduled publishing, examine indexing, or third-party integrations might get delayed or skipped.
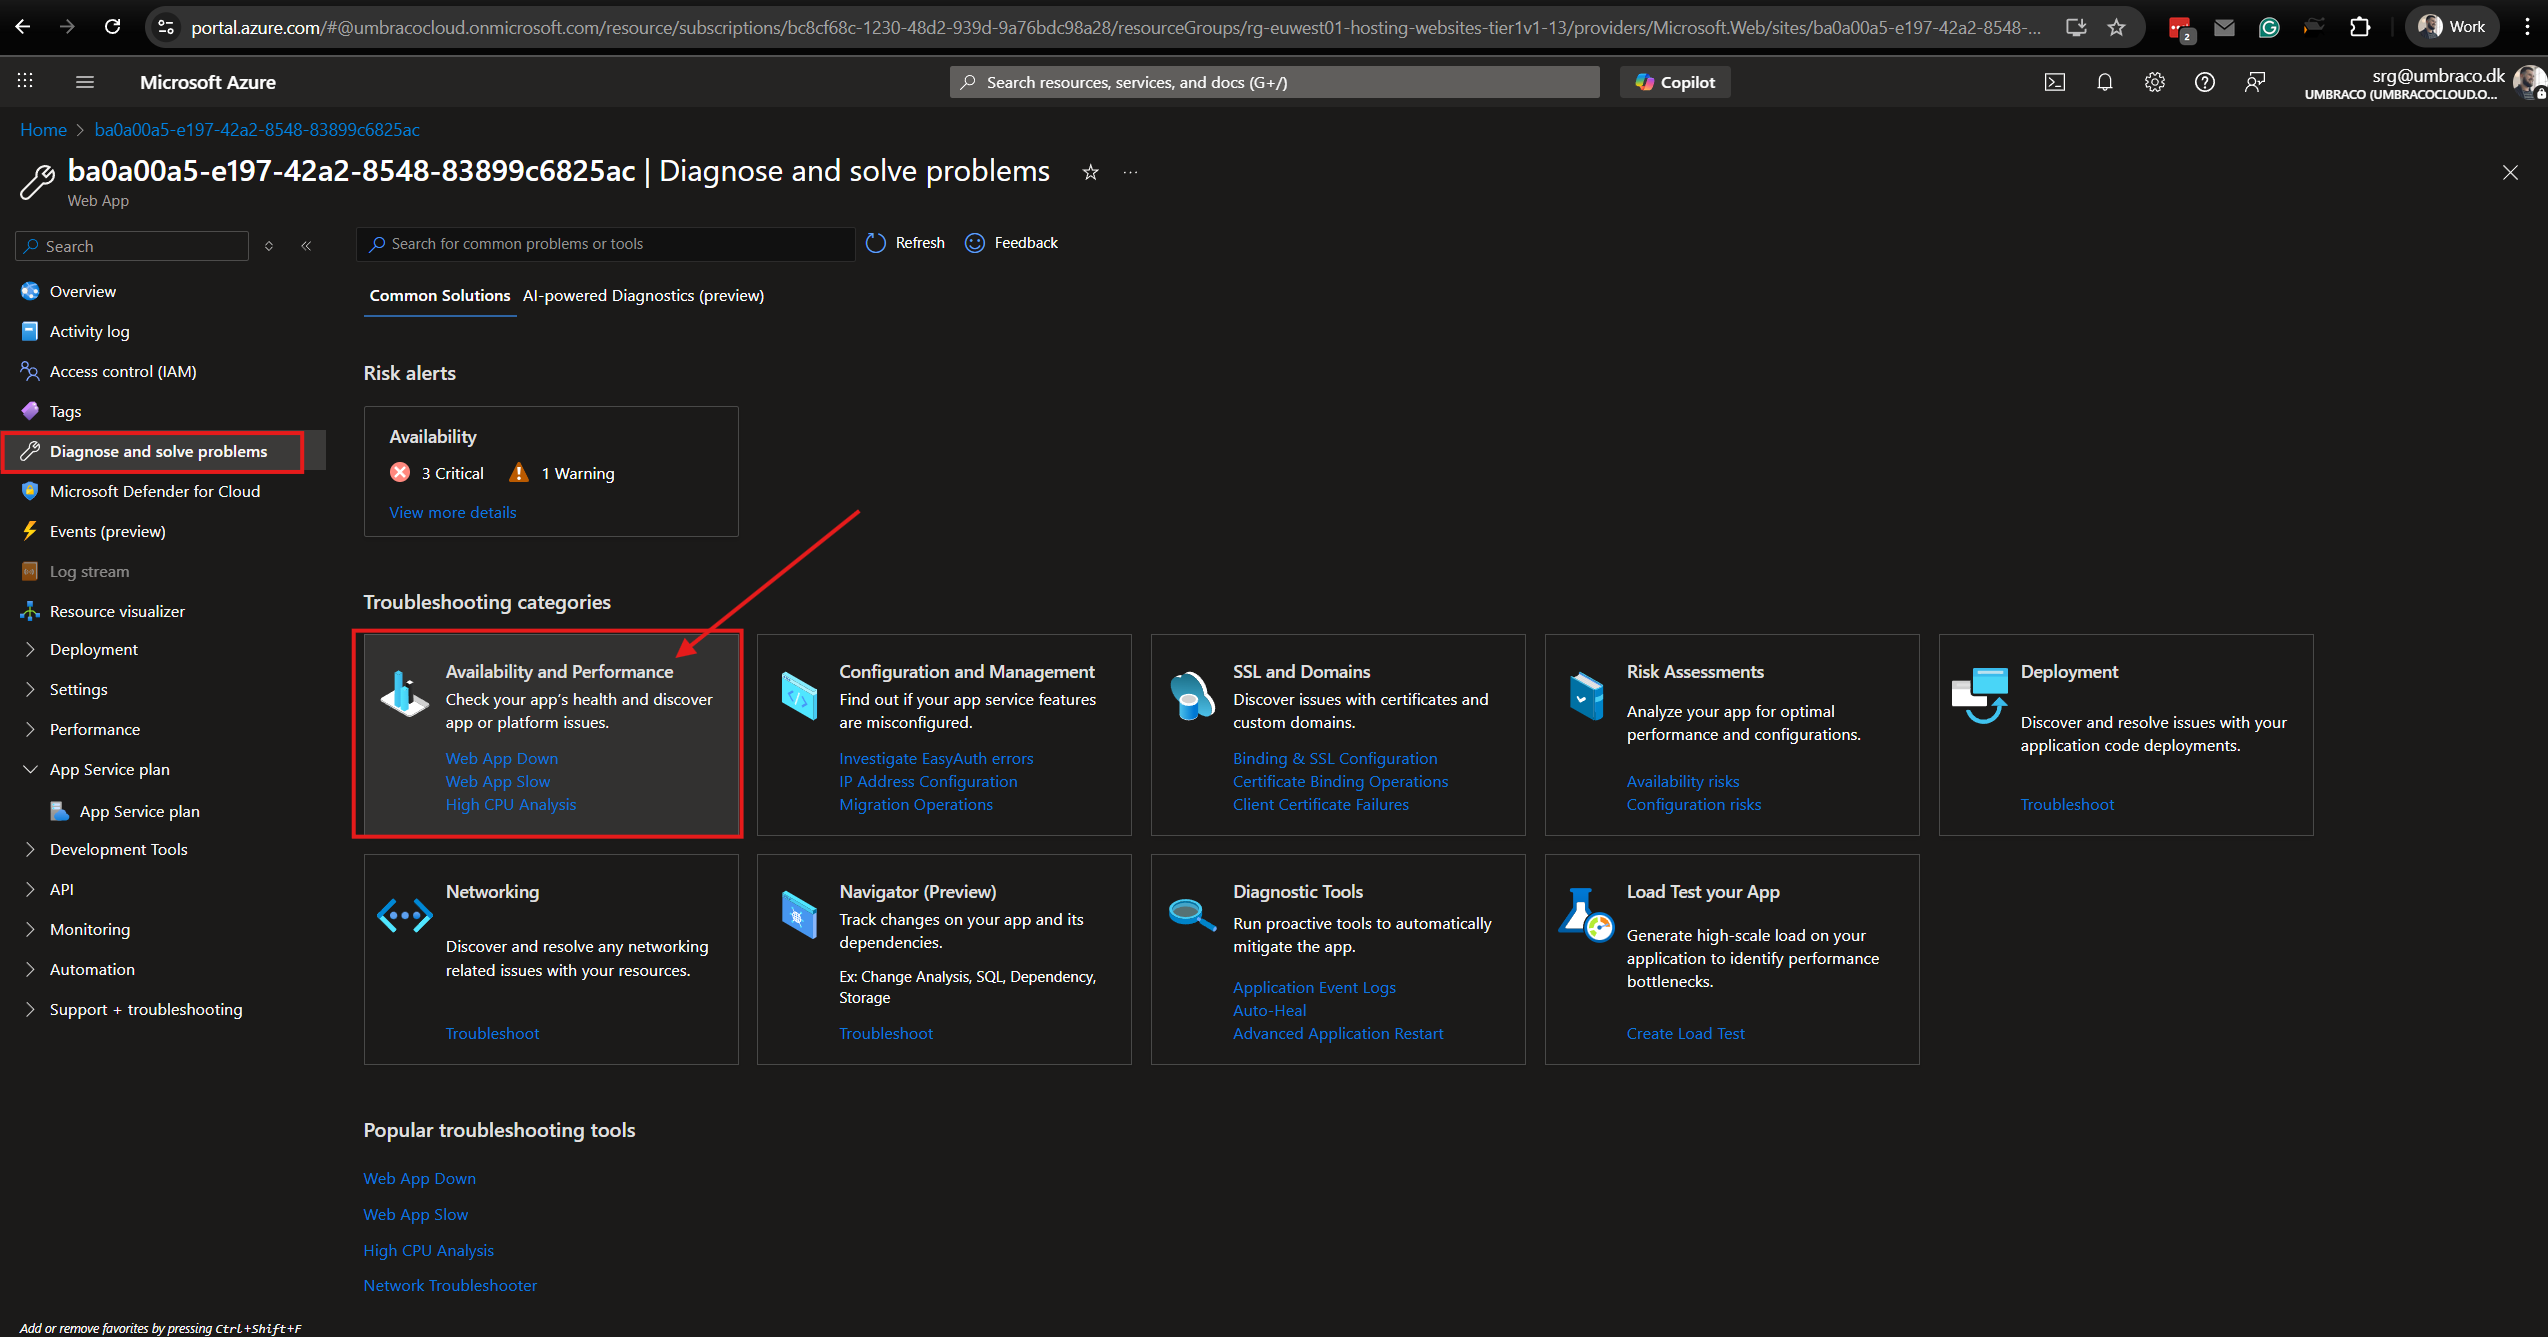
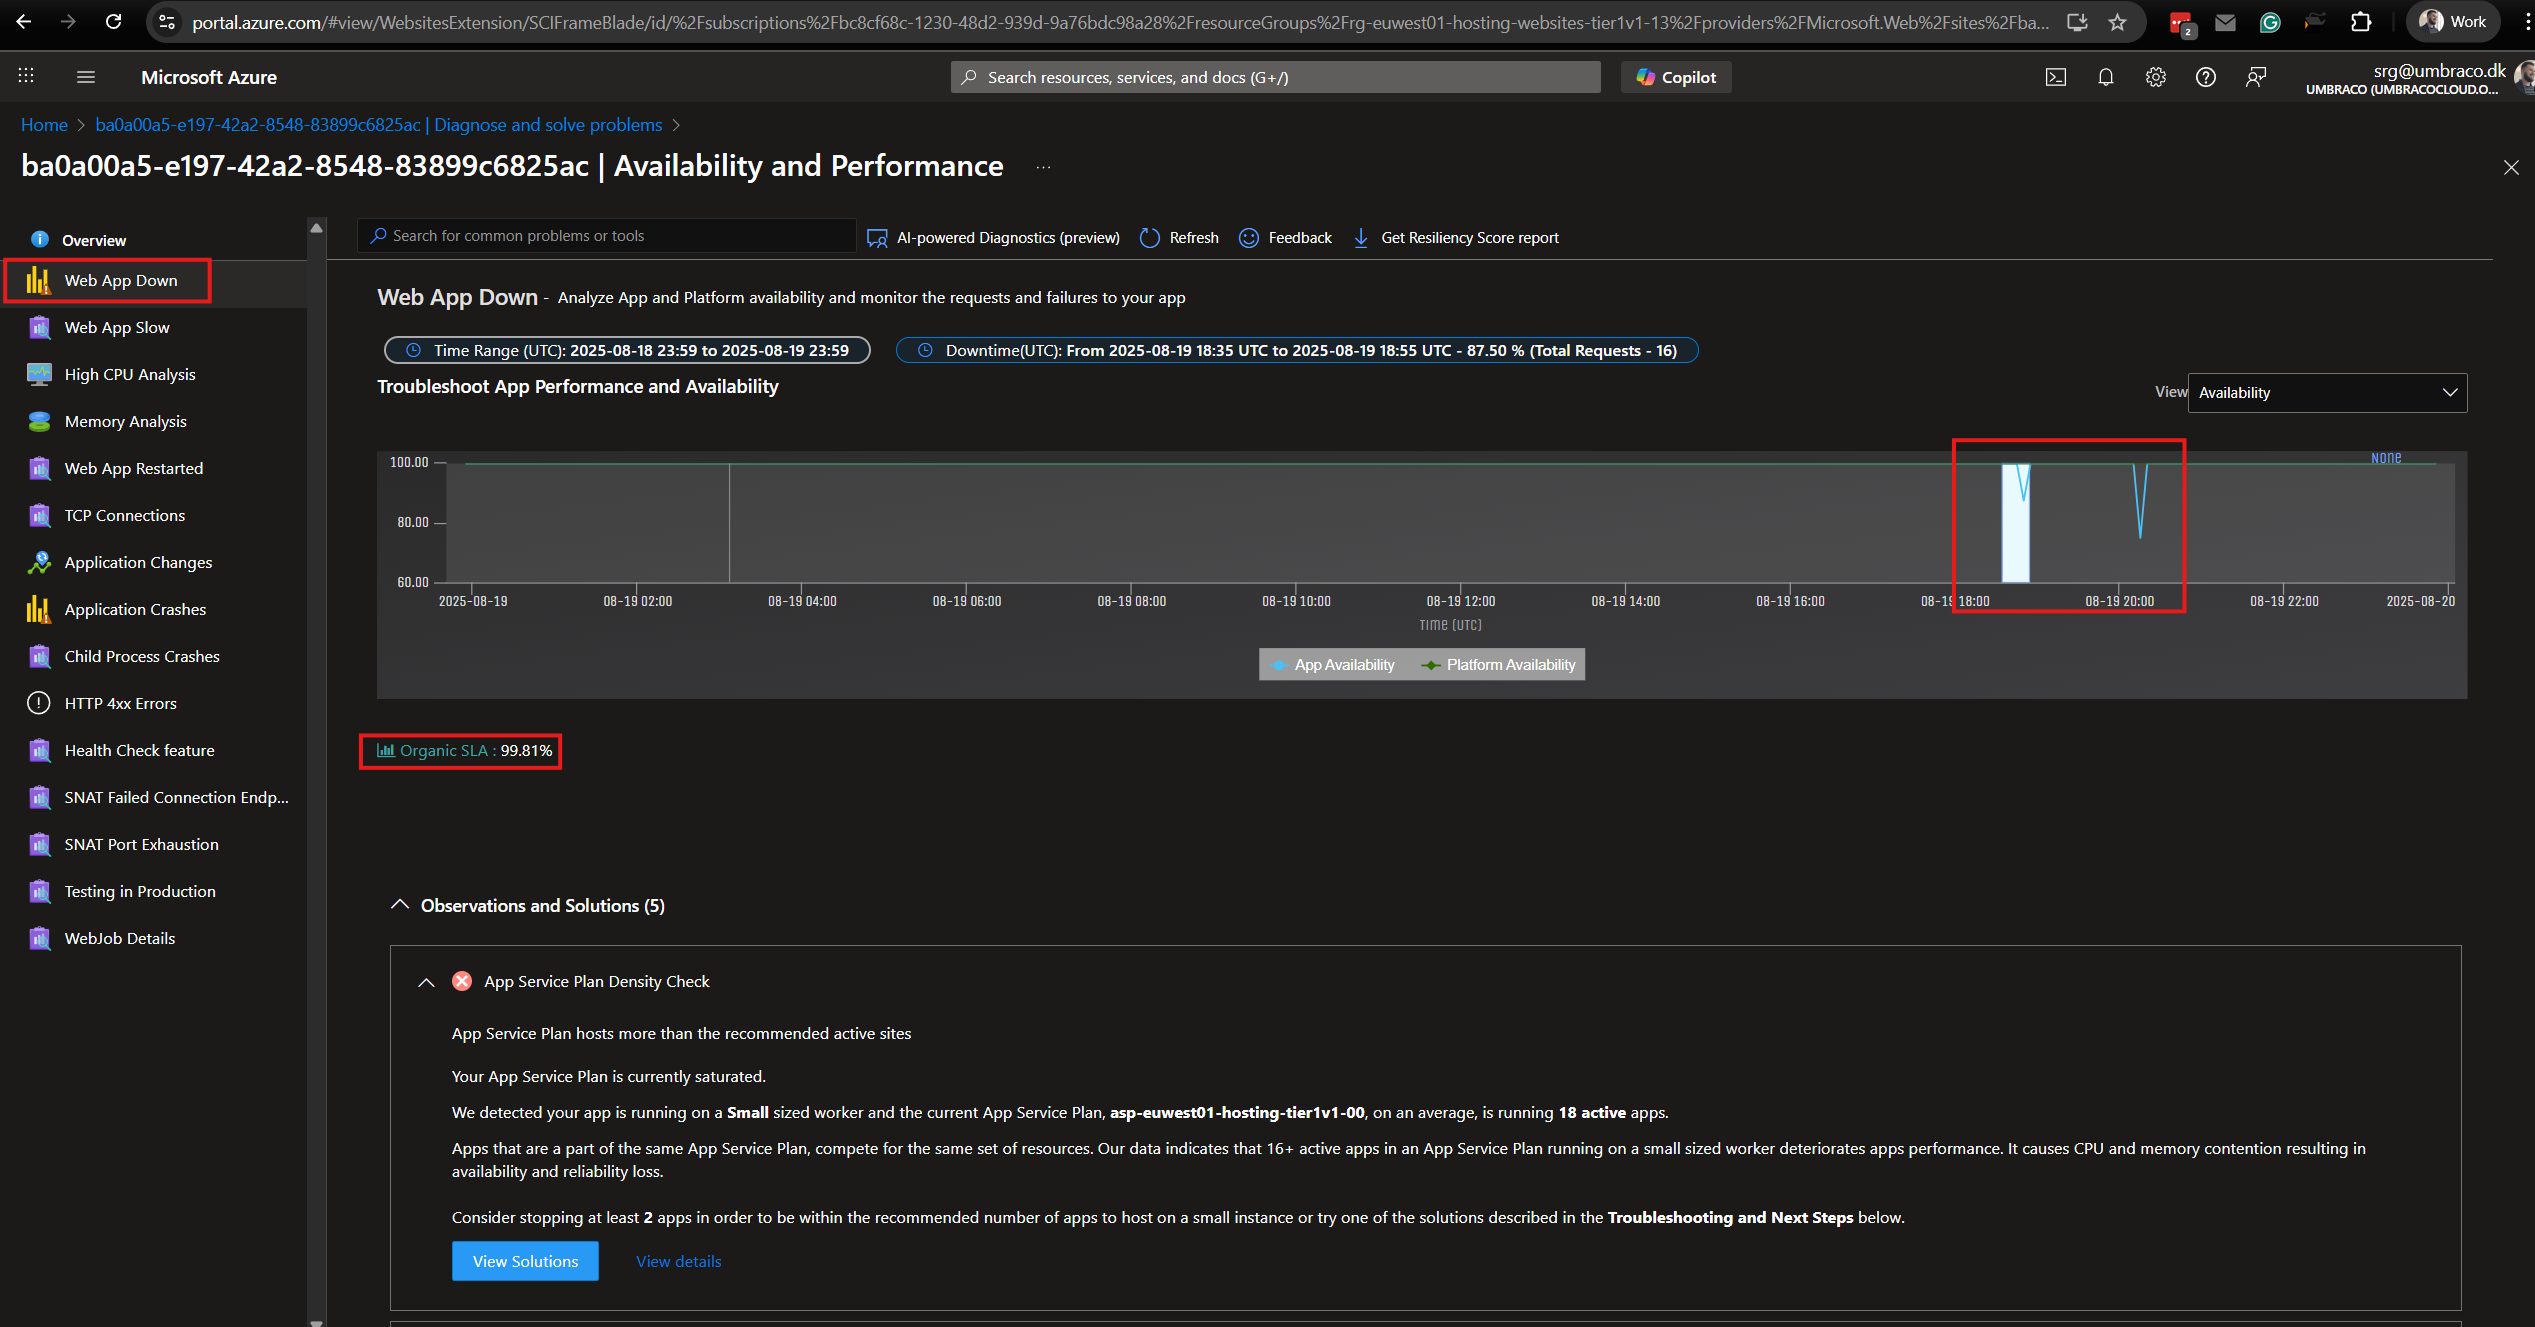
When to use:
Check this when customers report downtime or major slowness. If the DTU graph shows a sharp spike during that time, it's likely the database was the bottleneck.

Tips:

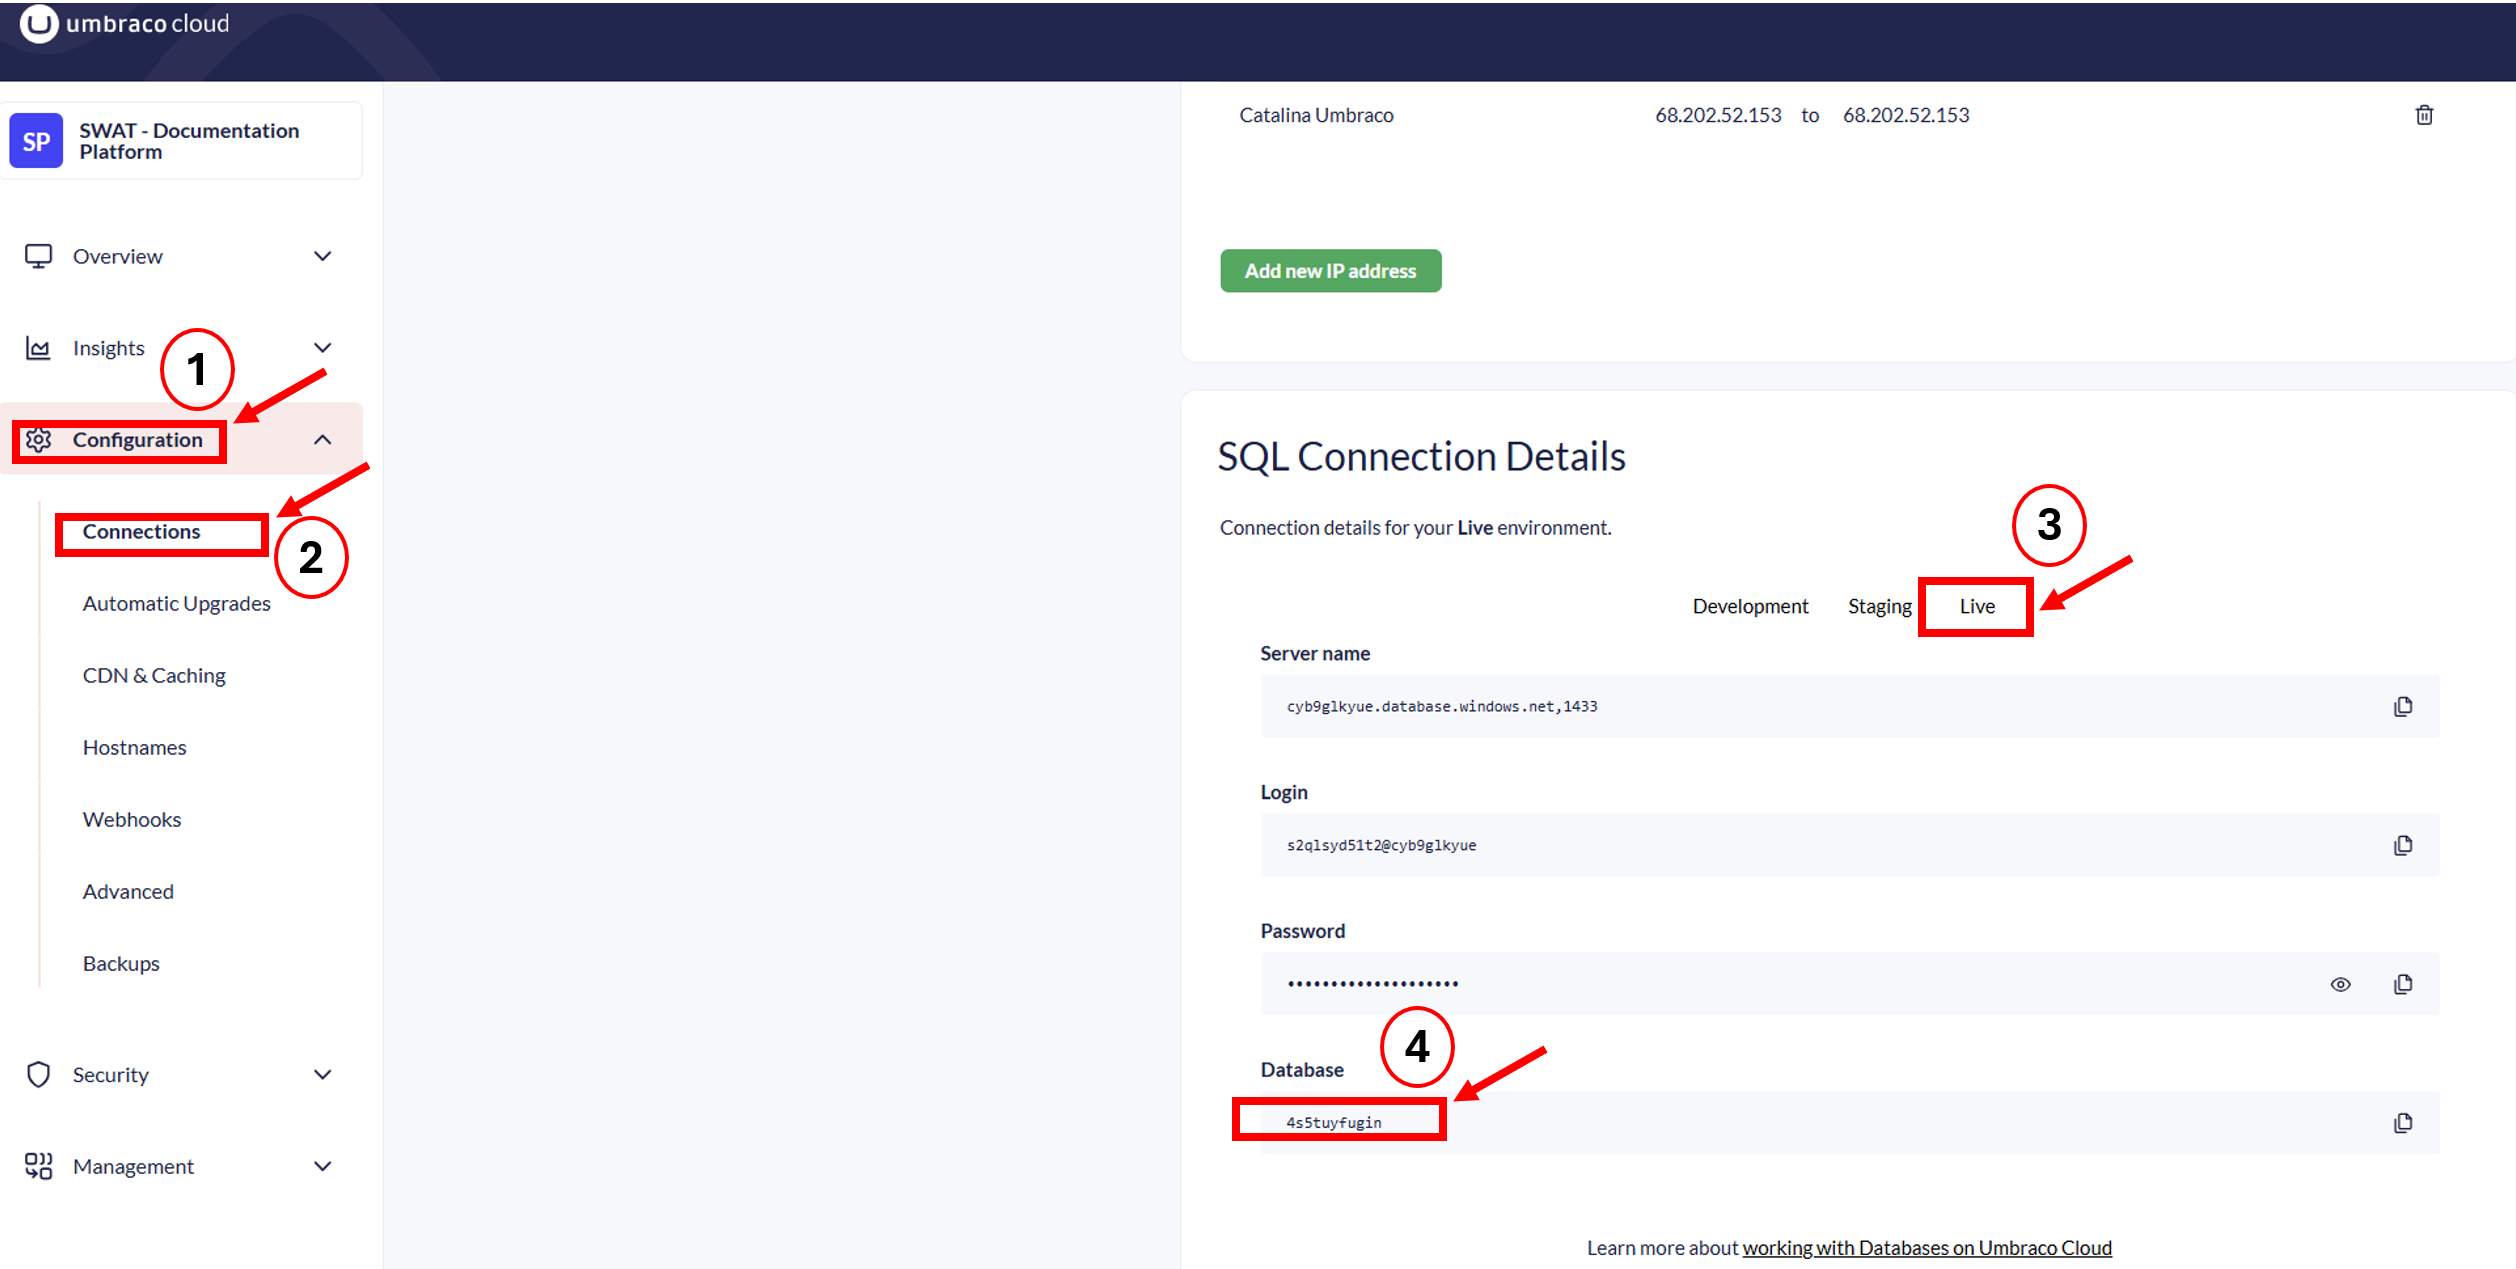
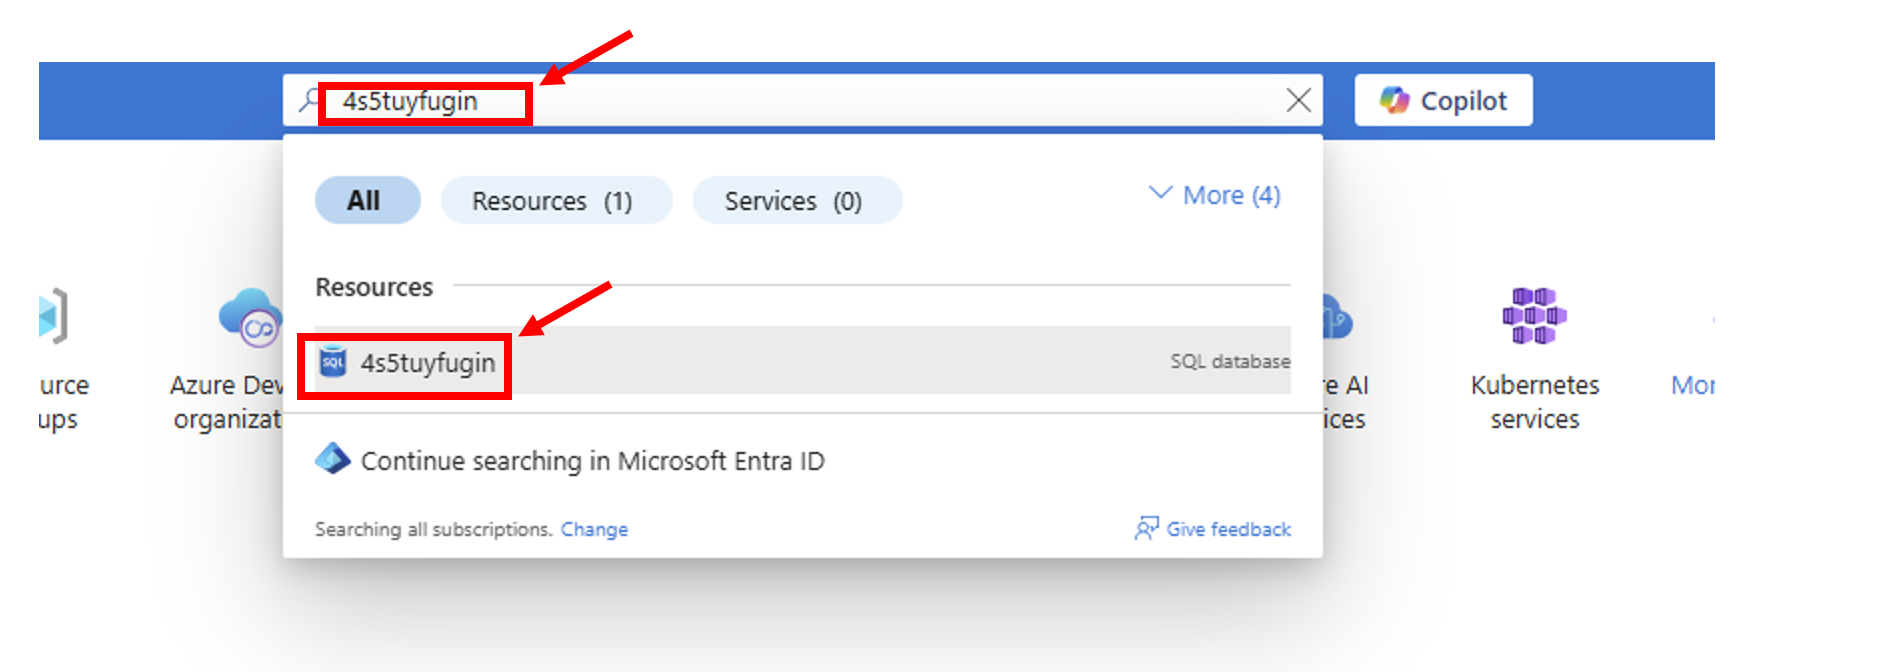
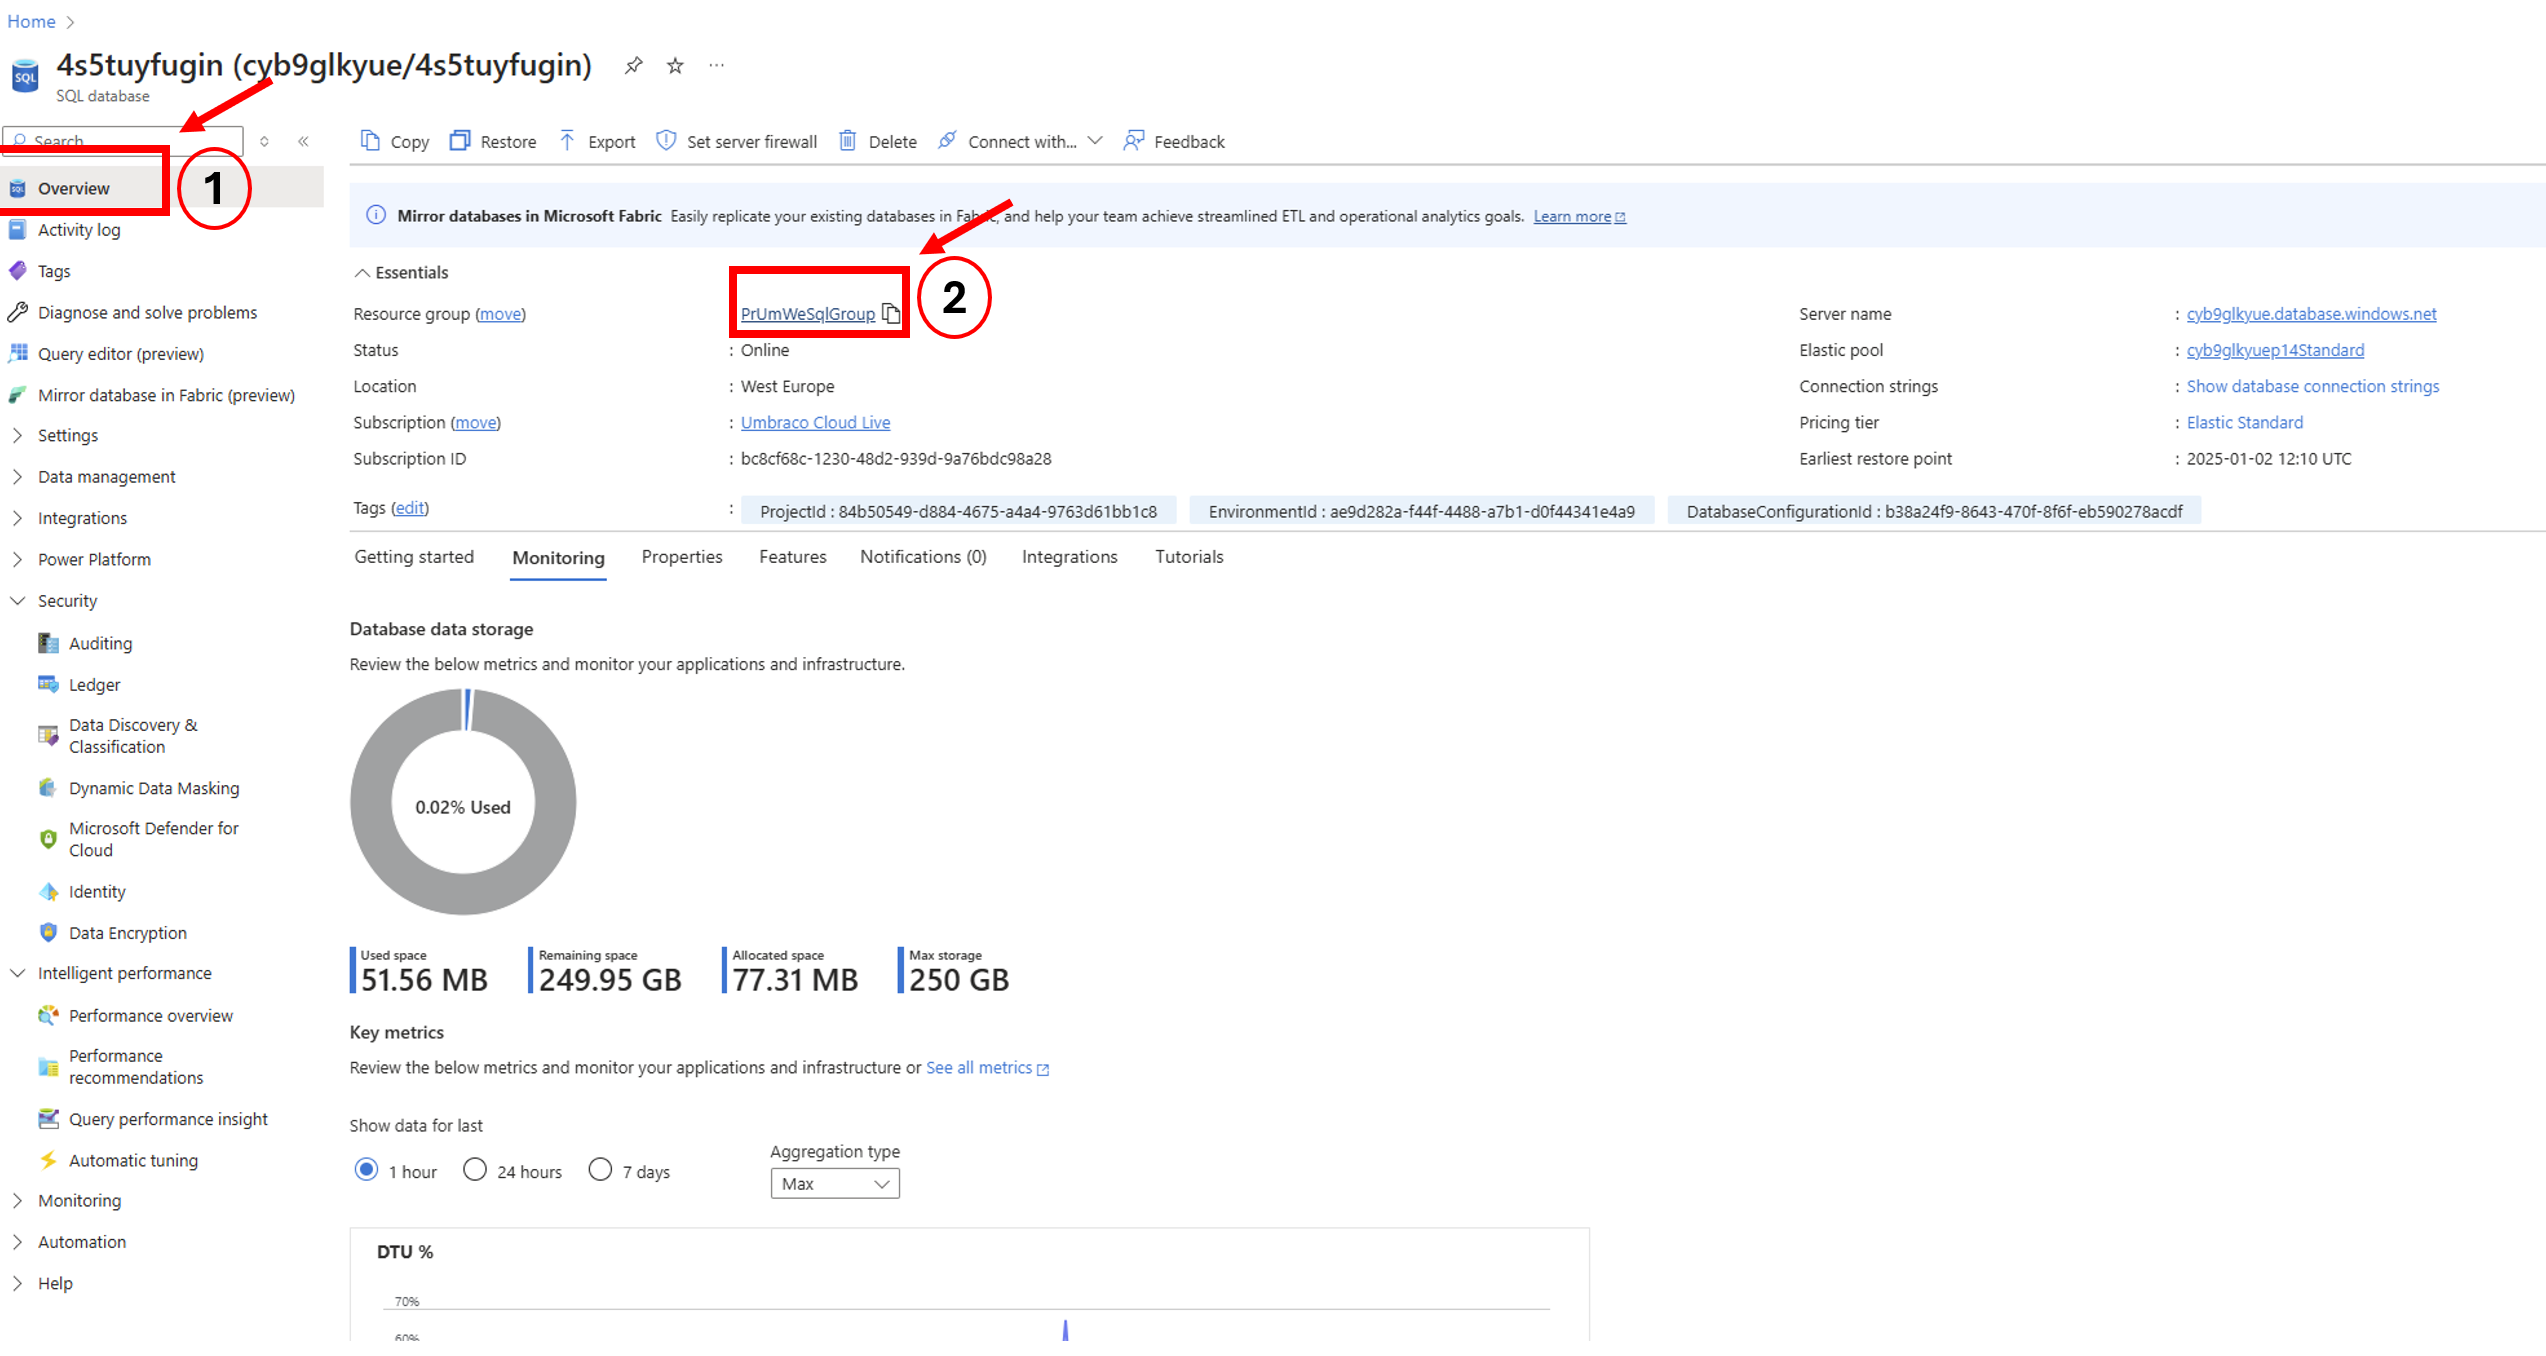
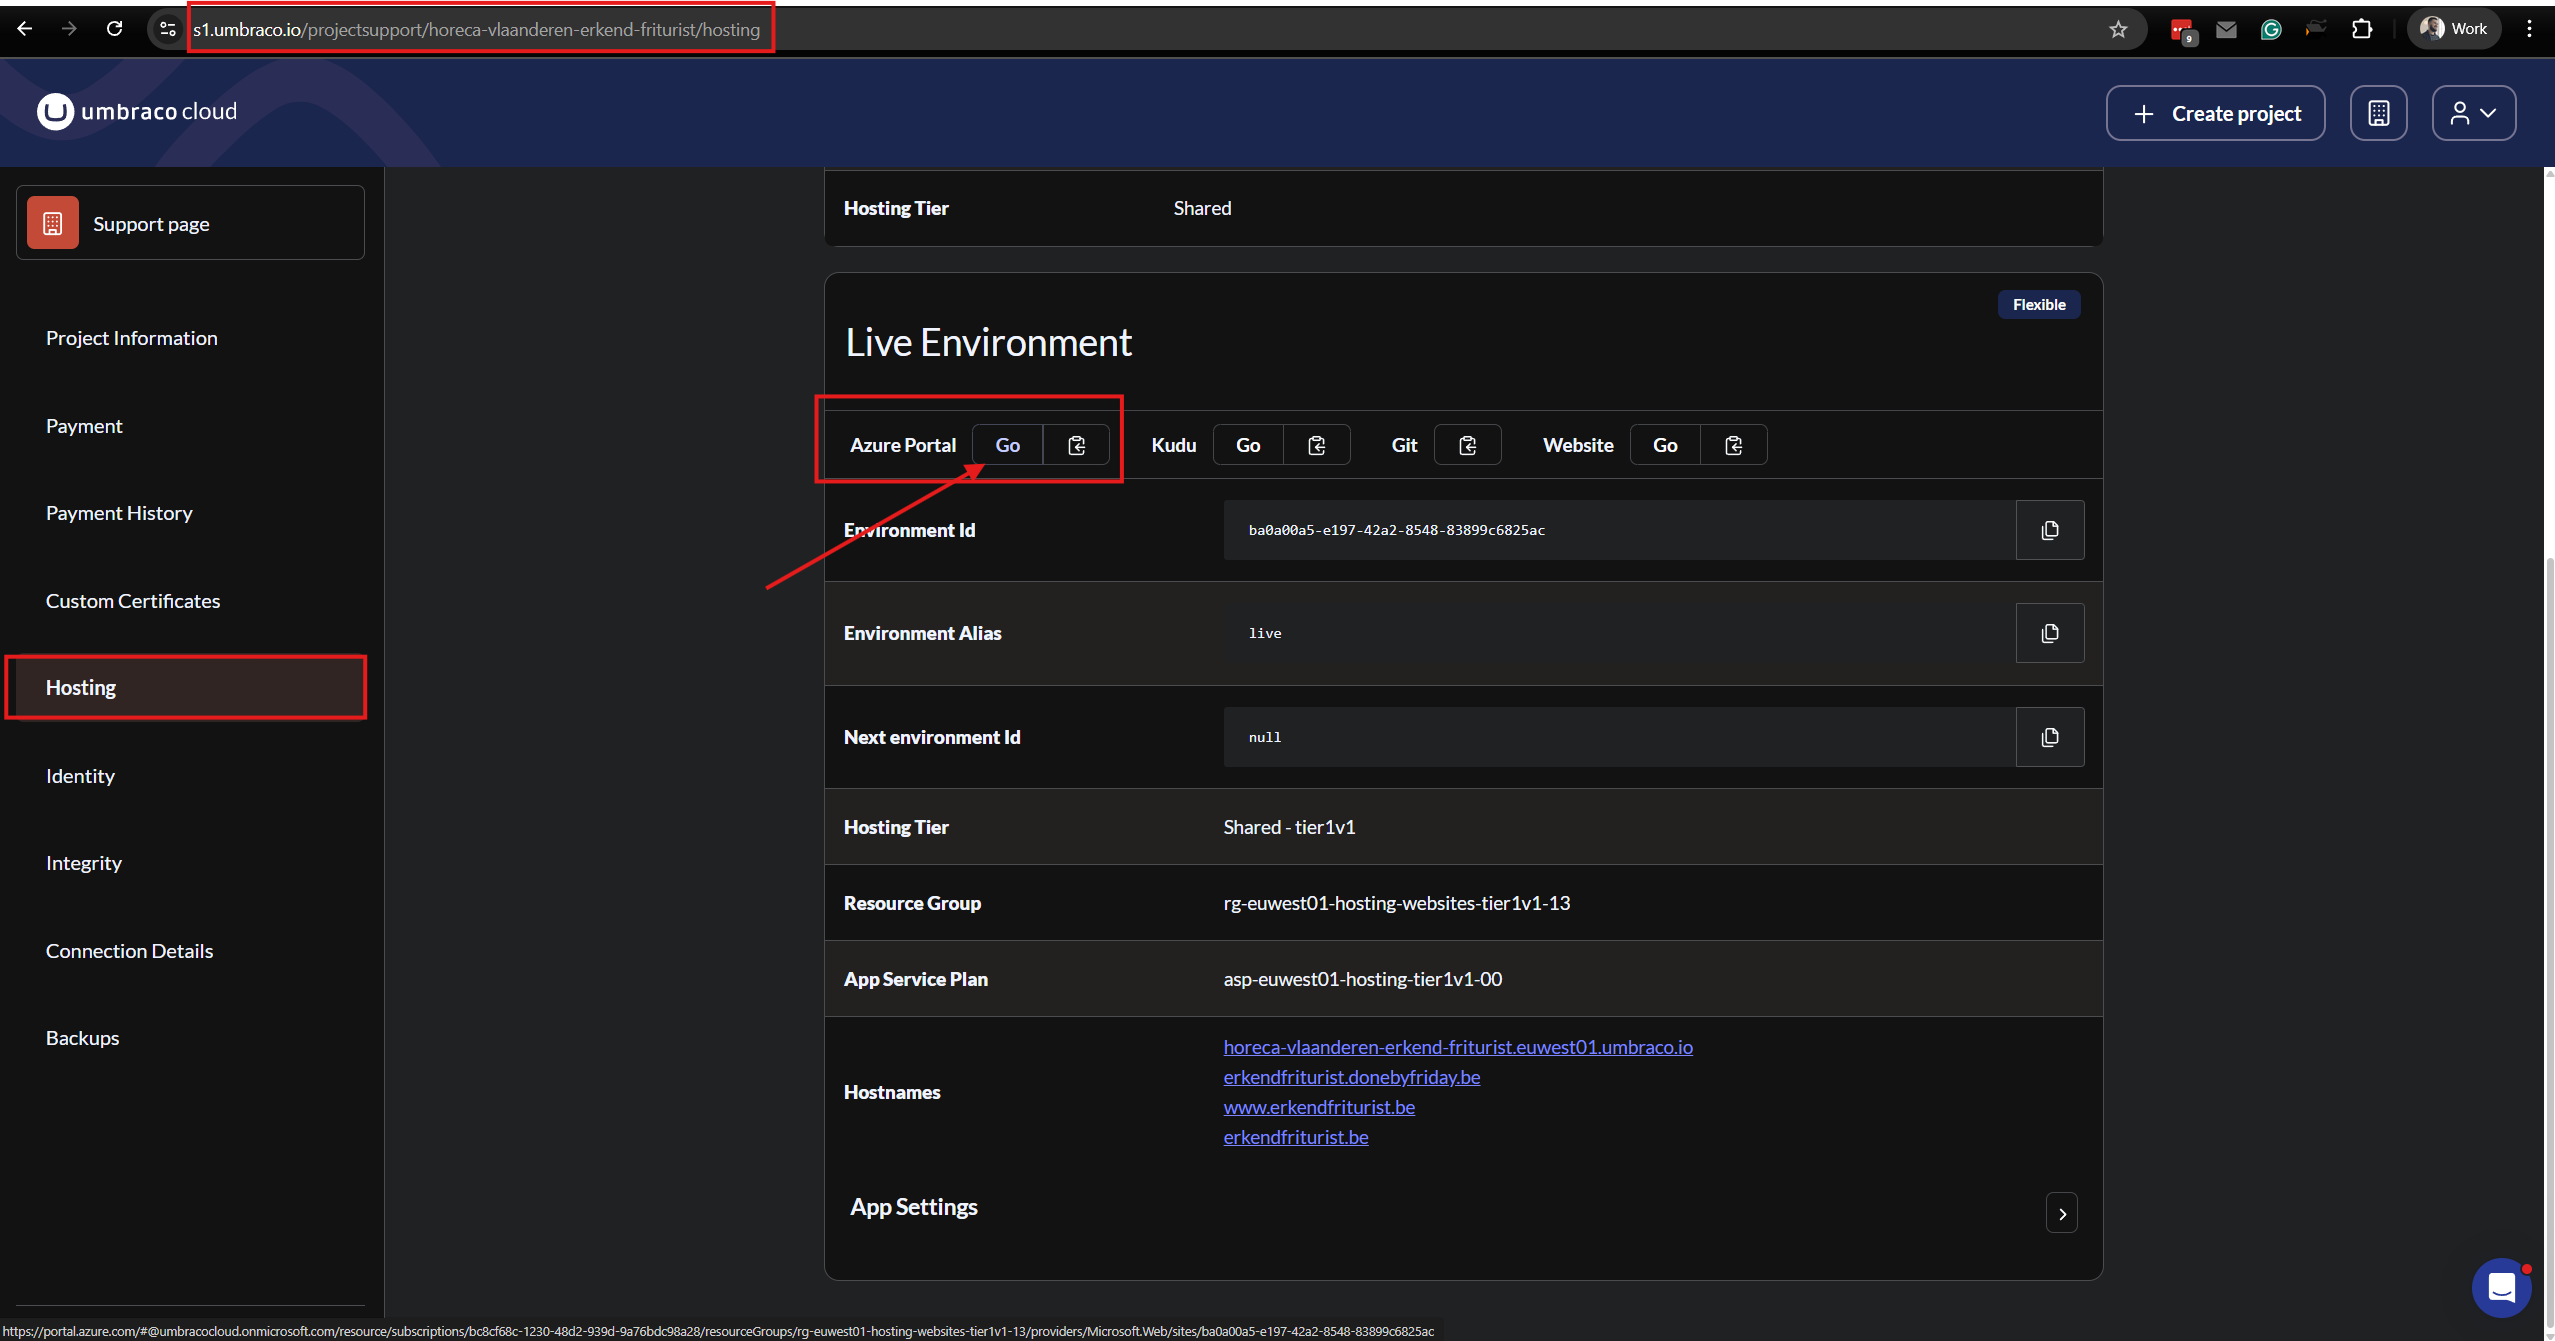
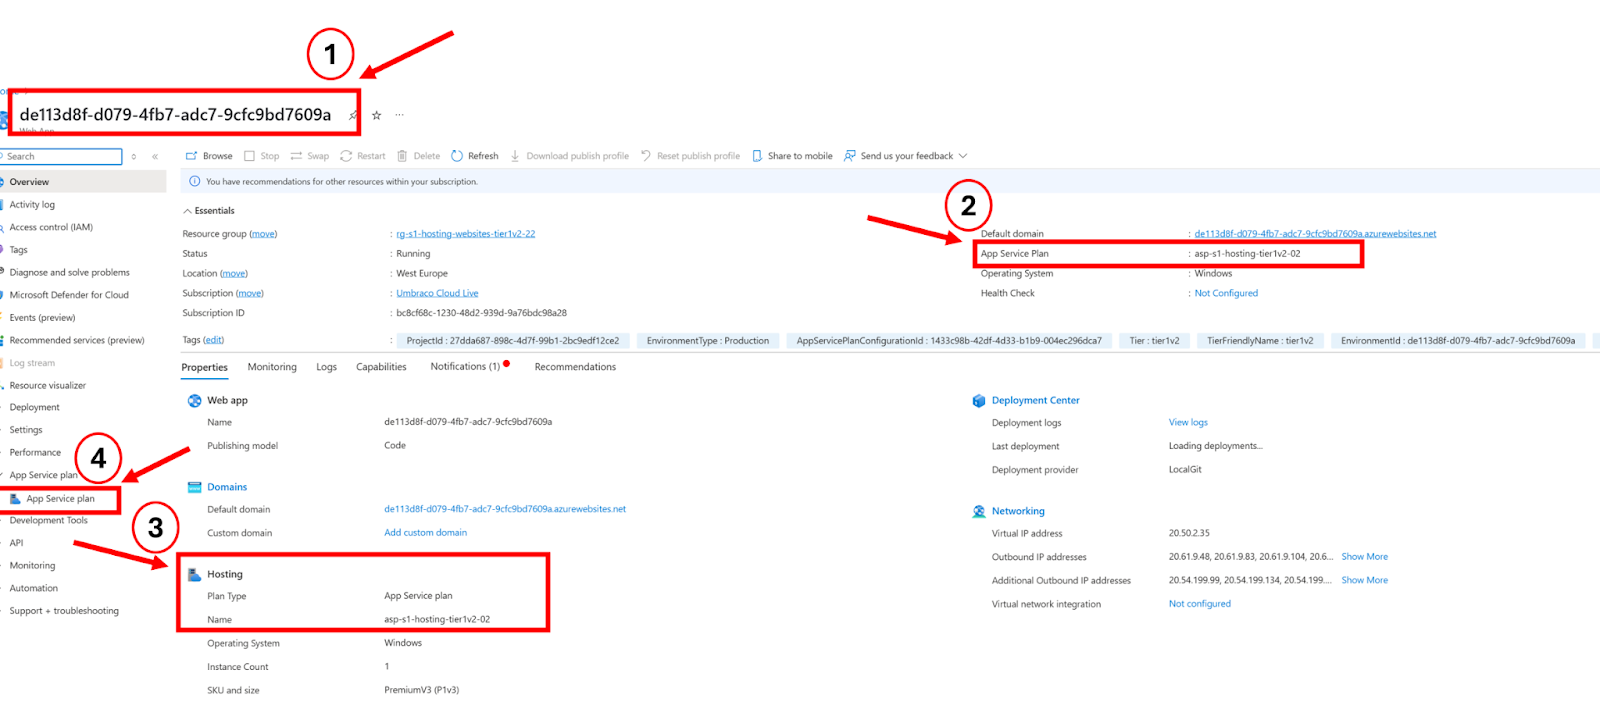
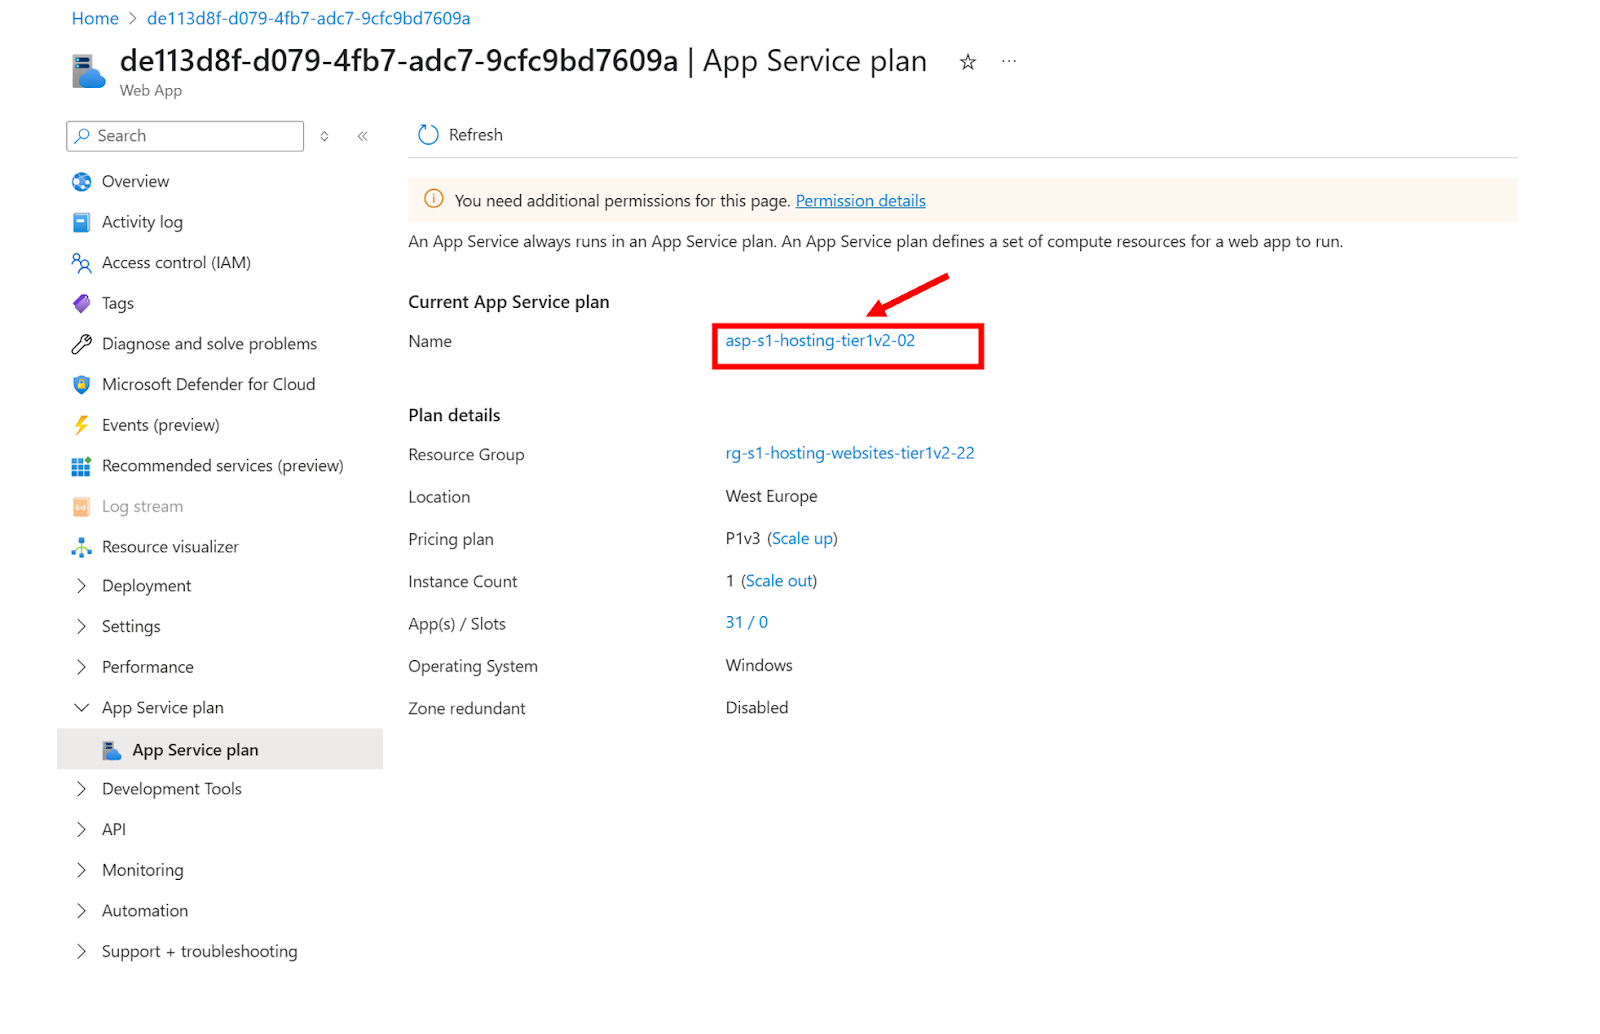
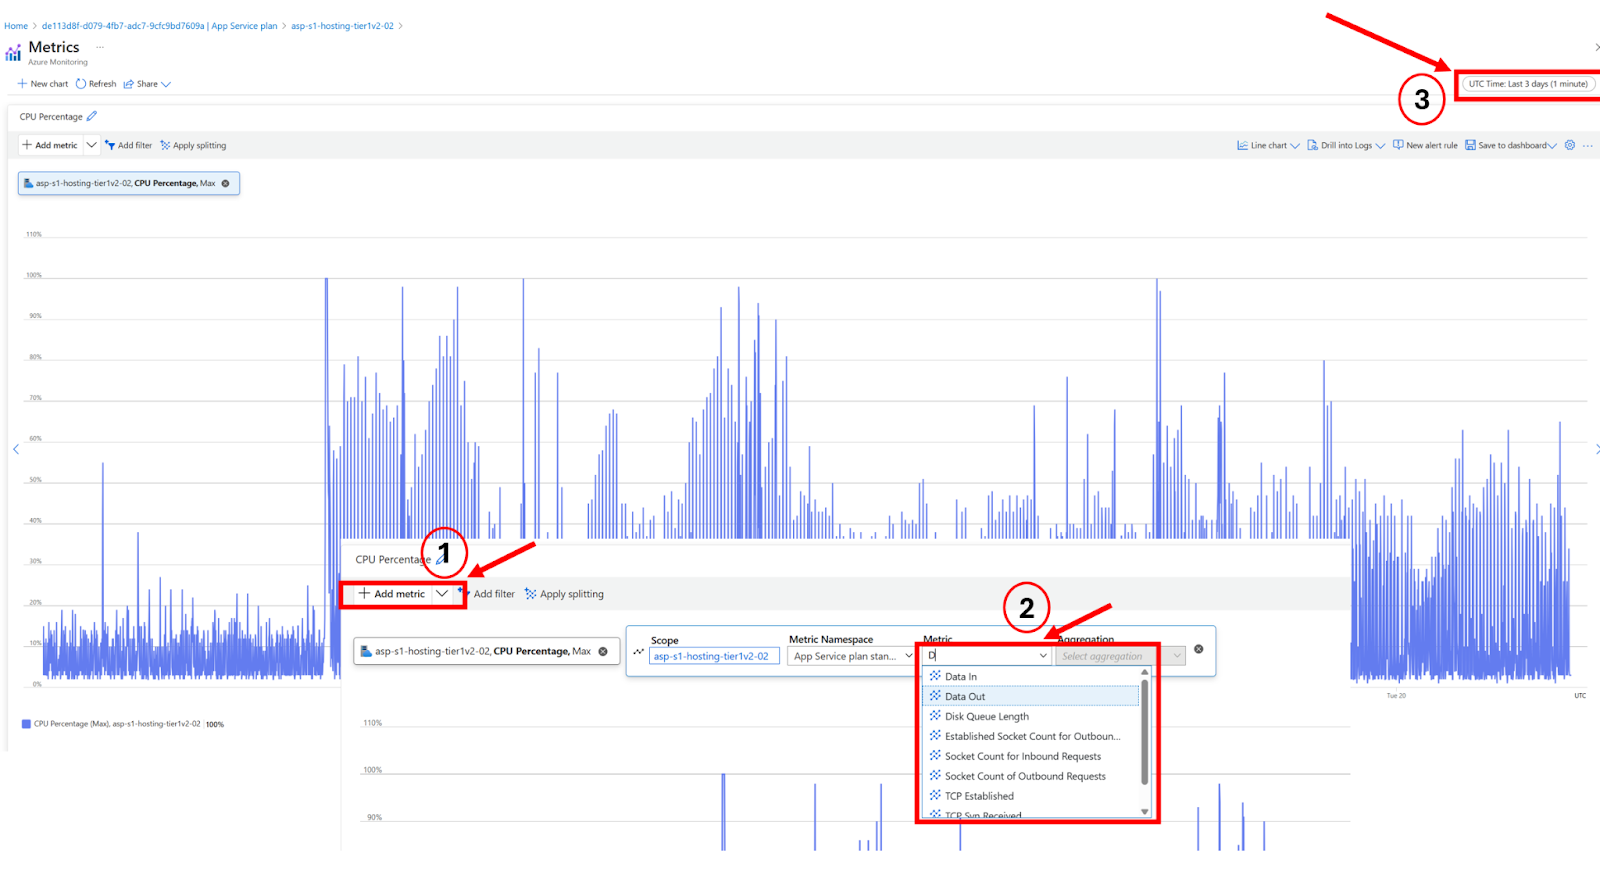
  • In Azure, you can search for the database by name (e.g., wjy1sq5zcyg)

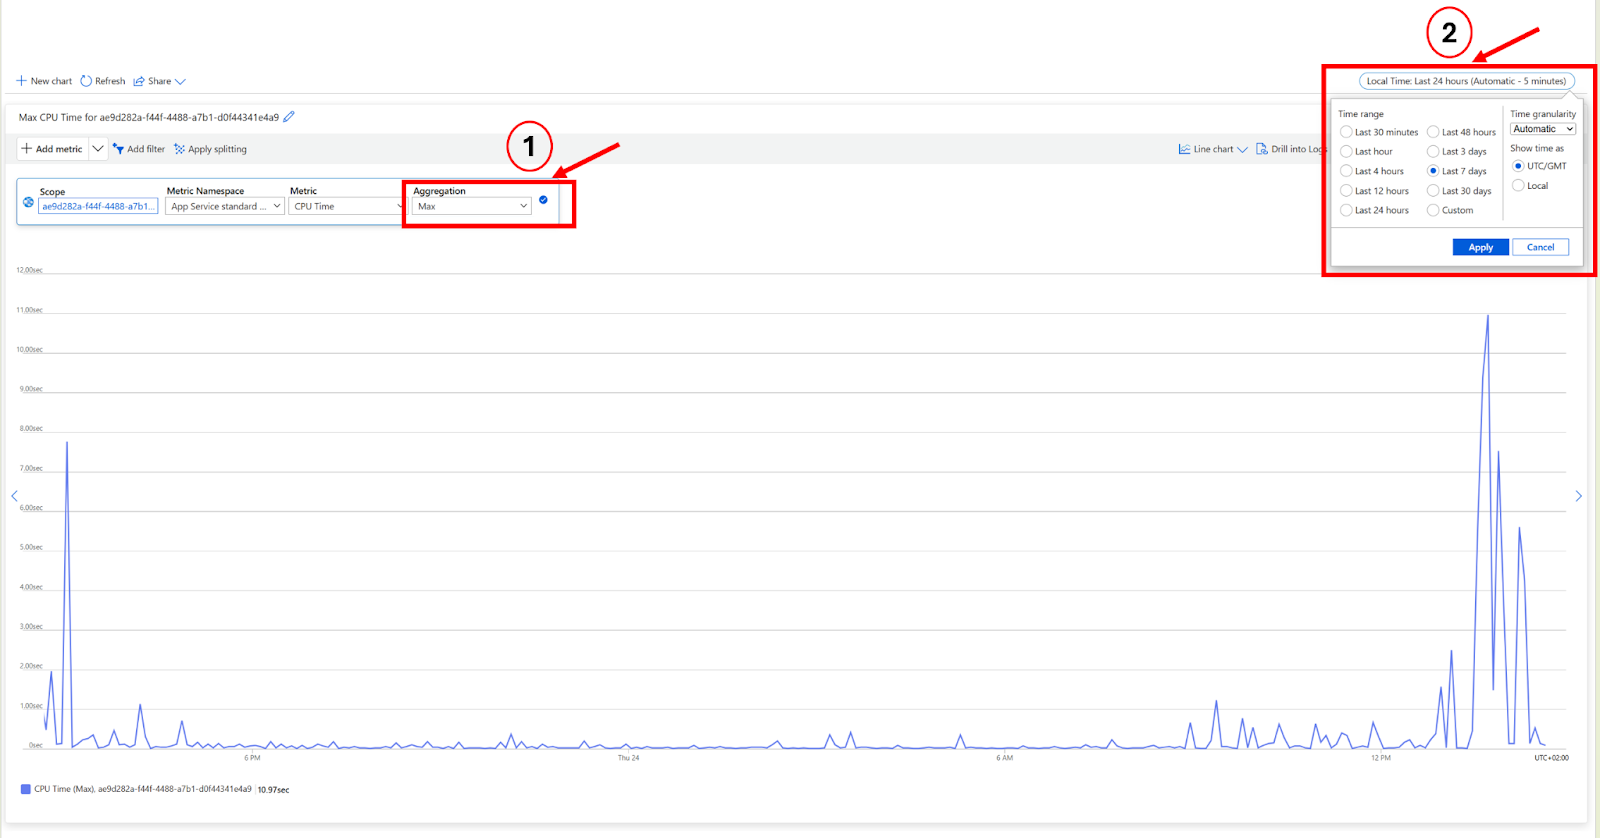
  • Look at the DTU % over time to identify if the issue was a one-time spike or part of a trend

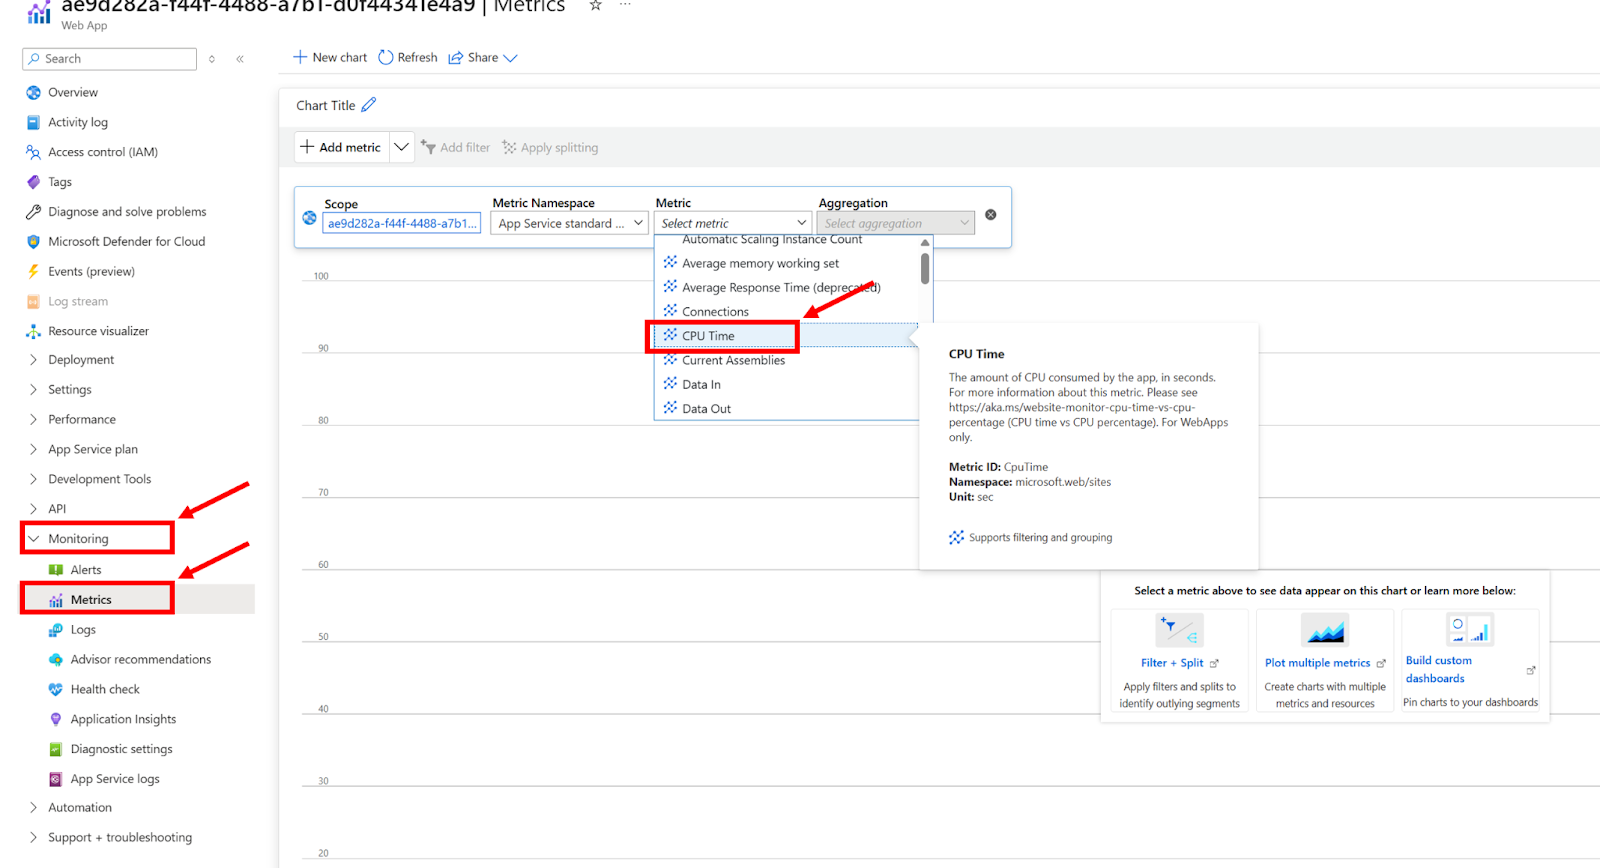
  • Click "See all metrics" to get more detailed breakdowns like storage usage, deadlocks, and query wait times

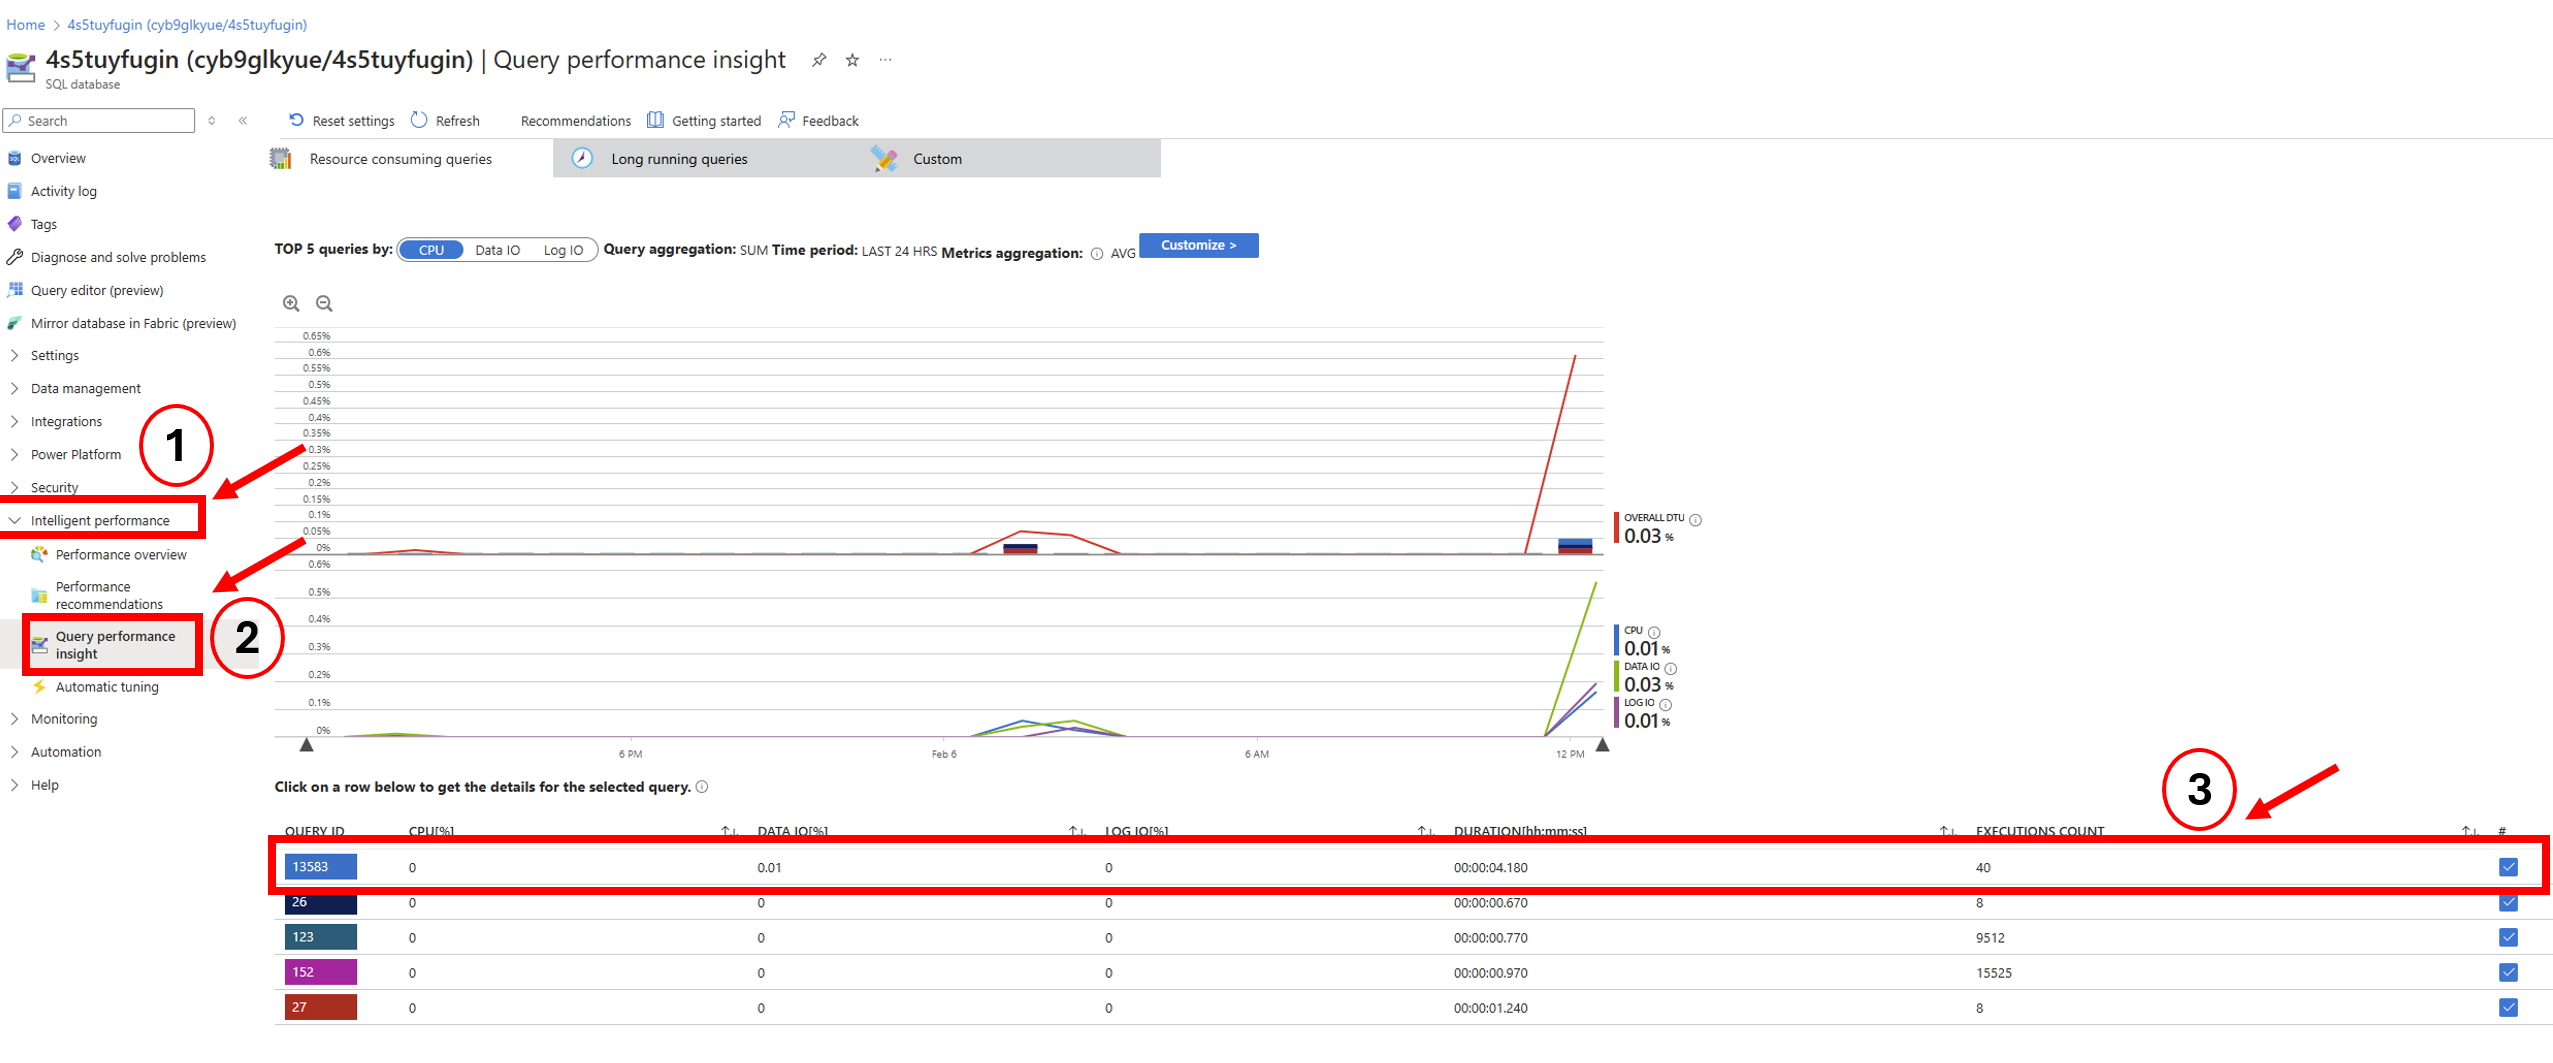
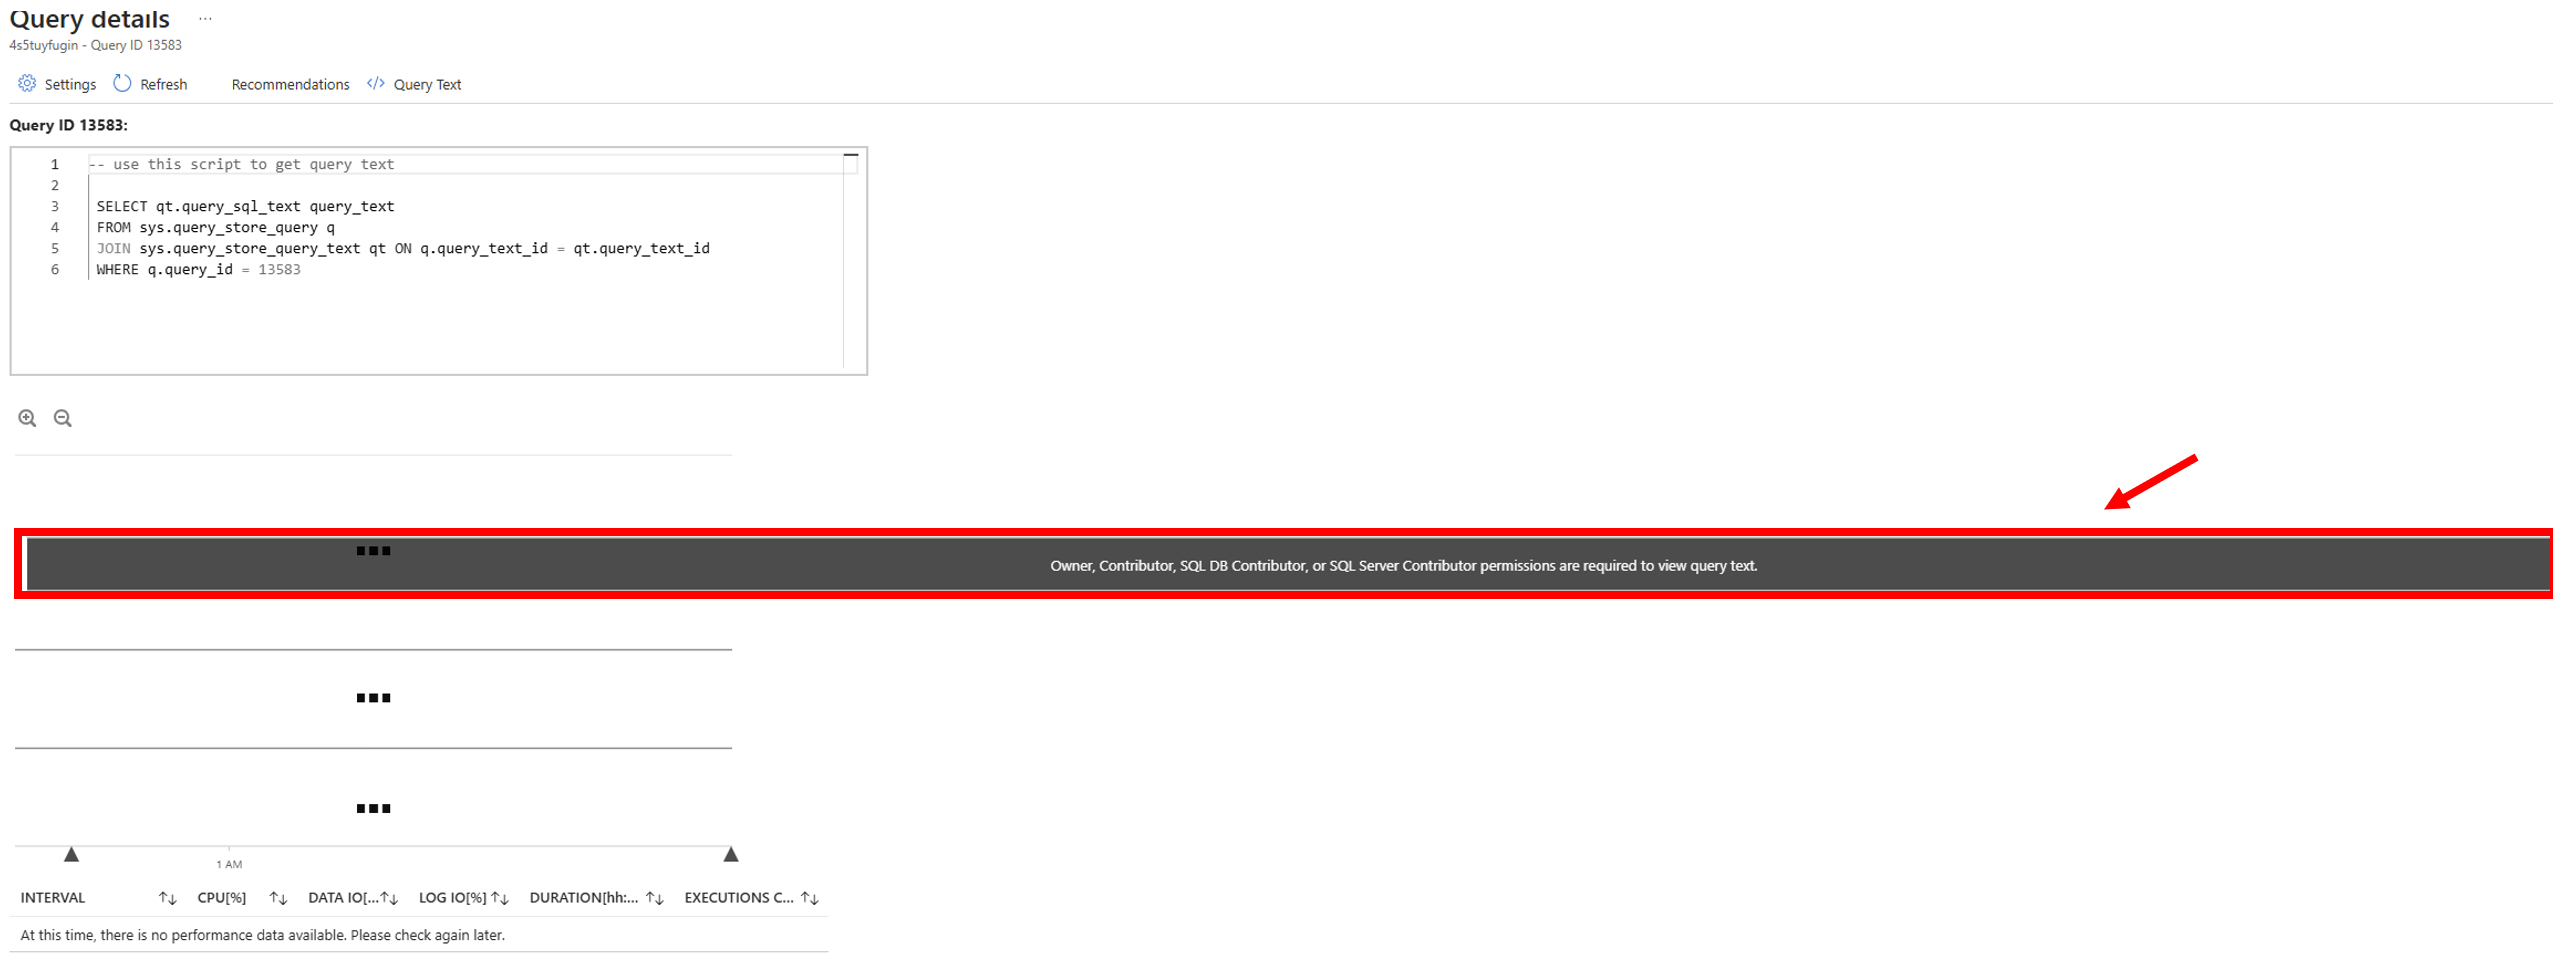
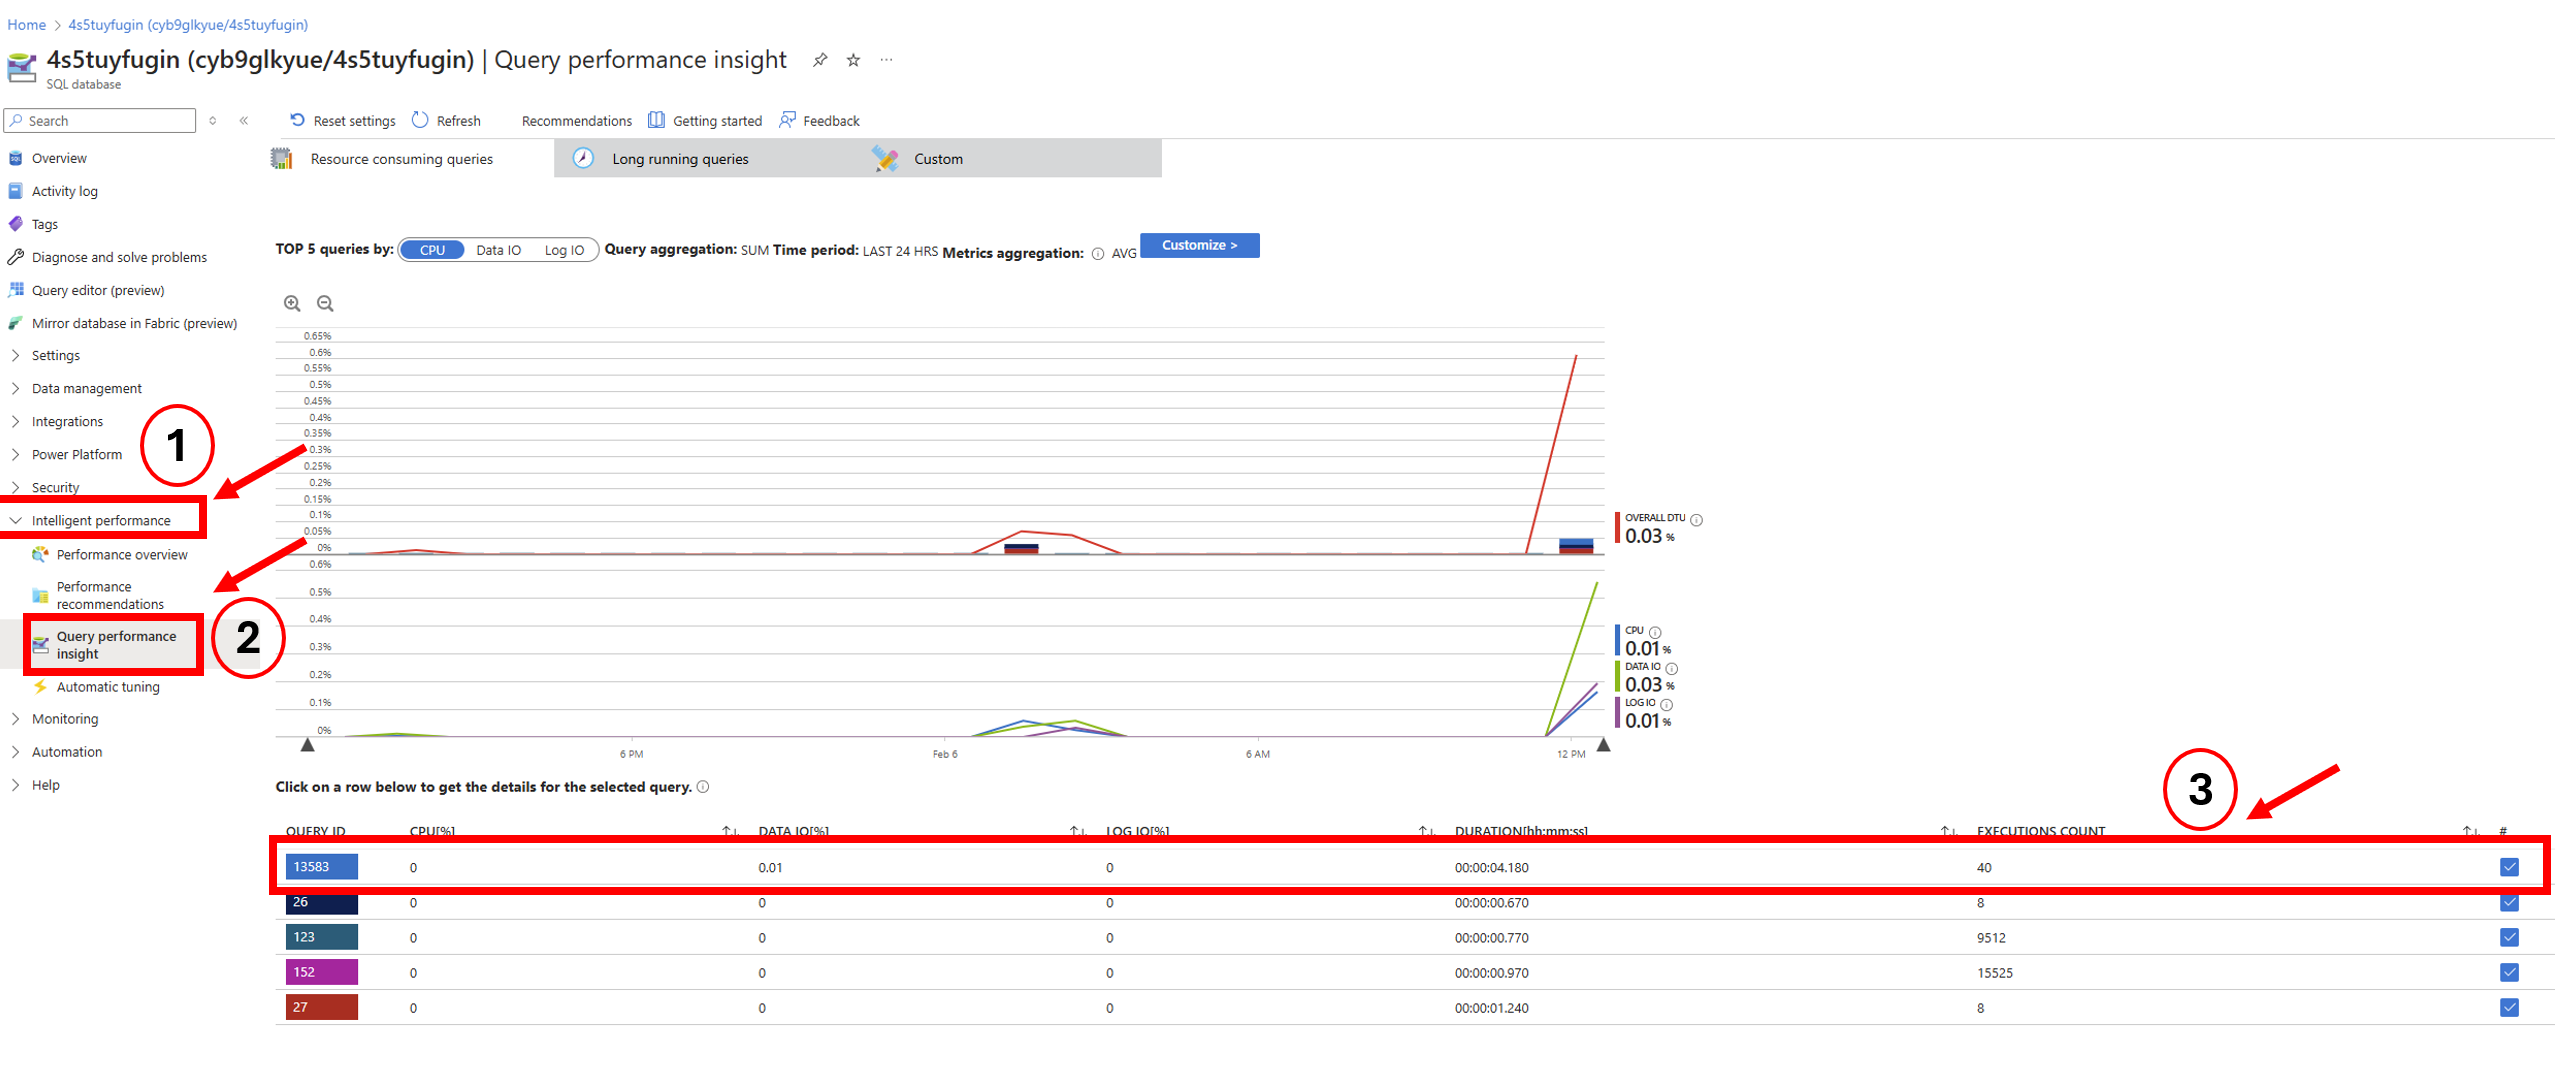
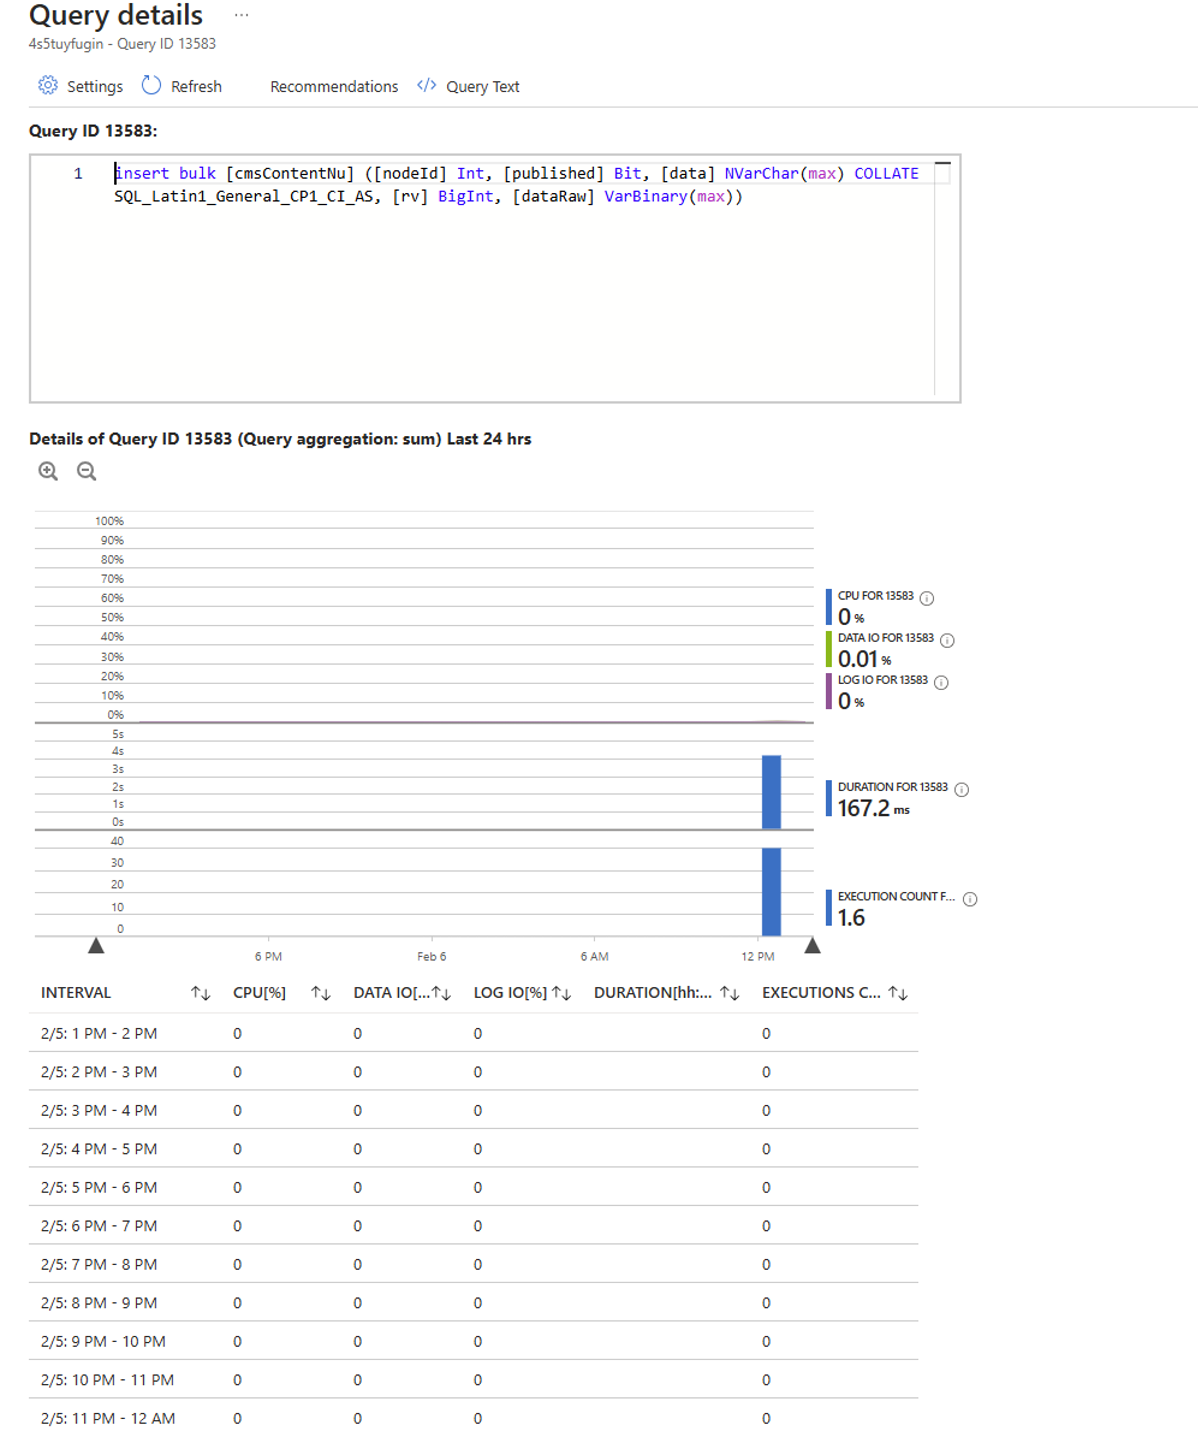
Advanced (Optional):
If needed, Azure also has tools like Query Performance Insight, which show which specific SQL commands or scheduled tasks were using the most resources. If you want to read ore about this, please see this article:

3.5 Application Insights

What it shows:

Detailed telemetry (automated monitoring data) about how your application behaves—errors, loading times, performance trends, and user interactions.

Why it matters:

Application Insights works like a real-time health dashboard for the app. It helps developers detect and understand performance issues, track slow responses, and trace errors back to their root cause. You can even see which features users interact with most.

Analogy:

It’s like the dashboard in your car. You can see how fast you're going, whether your engine is overheating, and if something needs attention. Instead of waiting for your car to break down, you get early warnings—same with Application Insights for apps.

When to use:

Only if the customer has set it up in their own Azure subscription. It’s helpful during detailed investigations into performance or stability problems. It can show exactly when and where things went wrong, especially after a new deployment.

Who installs it:

Customers must install Application Insights themselves using their own Azure subscription. It’s not active by default in Umbraco Cloud.

Where to learn more:

Set up Application Insights – Umbraco Docs: 

https://docs.umbraco.com/umbraco-cloud/expand-your-projects-capabilities/external-services/application-insights

Cold Boot vs. Warm Boot in Azure

When working with Umbraco Cloud, you may notice in Availability & Performance that Azure refers to cold and warm boots. These terms describe how an App Service instance starts up after being restarted.

Cold Boot

  • A cold boot happens when the application is started from scratch, without any cached data or preloaded assemblies.

  • This occurs when:

    • An app is deployed to a new instance during scaling.

    • The App Service plan restarts, or the underlying VM is recycled.

  • During a cold boot, application startup is slower because Umbraco must:

    • Load all necessary assemblies.

    • Initialize the application.

    • Compile and cache views.

    • Warm up dependencies (e.g., database connections, caching layers).

  • Impact: Customers may notice longer response times on the first request after a cold boot.

Warm Boot

  • A warm boot is when the application is restarted with cached context still available, making startup faster.

  • This typically happens when:

    • The app is restarted without underlying VM recycling.

  • Startup is faster because:

    • Cached assemblies and compiled code are reused.

    • Some in-memory state remains warm.

  • Impact for CX: Minimal downtime, and requests usually recover quickly after a warm boot.

Simple analogy:

  • Cold boot = turning on your PC after it’s been completely shut down (takes longer).

  • Warm boot = restarting your PC without fully powering off (faster because memory and system state are retained).